


Chapter 4 Examining Chromatogram Data
4-2 Applied Biosystems
4
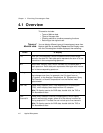
4.1 Overview
This section includes:
• Types of Mariner data
• Types of Voyager data
• Creating macros to combine processing functions
• Returning to the original trace
Types of
Mariner data
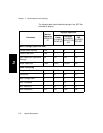
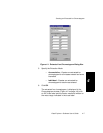
You can display different types of chromatogram traces from
Mariner data files by selecting Traces from the Display menu
with the Chromatogram window displayed, then selecting:
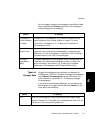
Select To display
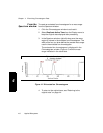
TIC Total Ion Chromatogram, which includes the entire mass range
saved in the data file. Each data point represents the sum of all ion
intensities in the corresponding spectrum.
BPI Base Peak Intensity trace, which includes only the base peak in
each spectrum. Each data point represents the single most intense
ion in the corresponding spectrum.
Analog Trace of the input from an outside source representing any signal
that changes over time, for example, the UV signal from an
LC system, or the Analyzer Temperature, Air Temperature, Spray
Tip Potential, or Nozzle Temperature from the Mariner mass
spectrometer.
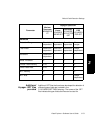
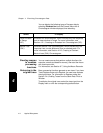
DAD TAC Diode Array Detector (DAD) Total Absorbance Chromatogram
(TAC), which displays data acquired from LC samples.
Hint: To display spectra for DAD data, double-click the TAC or
Ch Absorbance trace.
DAD
Channel N
Diode Array Detector Channel chromatograms, which display
specific wavelength ranges, where N is the channel number set
during acquisition. The data file can include up to five channels.
Hint: To display spectra for DAD data, double-click the TAC or
Ch Absorbance trace