


Deisotoping a Spectrum
Data Explorer
™
Software User’s Guide 3-45
3
3.4 Deisotoping a Spectrum
This section includes:
• Description
• During peak deisotoping
• When to use
• Requirements
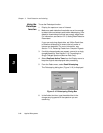
• Using the Deisotope function
• Troubleshooting
• Example
• Returning to the original spectrum
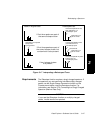
Description The Deisotope function reduces a spectrum to a centroided
plot by deconvoluting the monoisotopic peaks from the current
peak list.
Peak deisotoping is an advanced peak filtering method that
can determine the relative abundance of multiple components
with overlapping isotope distributions. The deisotoping
algorithm uses the elemental composition that you specify to
improve the determination of the monoisotopic mass by
considering the centroid masses of all peaks in the isotopic
envelope.
During peak
deisotoping
For each detected peak in a spectrum, the software inspects
the peak list for the higher theoretical masses and areas
associated with additional expected peaks in a theoretical
isotopic cluster, relative to the peak in question.