


Chapter 3 Peak Detection and Labeling
3-46 Applied Biosystems
3
If the expected higher theoretical peak masses and areas are
present in the peak list:
• The peak in question is considered to be a monoisotopic
peak.
• The intensities of the higher mass peaks that correspond
to the expected isotope ratios are combined with the
intensity of the peak in question (additional intensity that
may be related to a contaminant or an overlapping
isotope envelope is not combined, and will be evaluated
in the next iteration).
• The peak in question is represented in the trace as a
centroid bar with increased amplitude. The total intensity
of the centroid bar represents the total area of each fitted
cluster.
If the expected higher theoretical peak masses and areas are
not present in the peak list, the peak in question is
represented in the trace as a centroid bar with its original
amplitude.
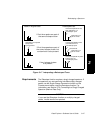
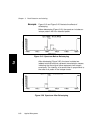
Figure 3-17 illustrates how peaks that are and peaks that are
not part of an isotope cluster are represented in a deisotoped
trace.
When to use For most applications, particularly peptide analysis, the
deisotoping function yields more useful results than
monoisotopic peak filtering (described in Section 3.3.4,
Sorting, Filtering, and Printing the Peak List) because the
deisotoping function:
• Can successfully identify the monoisotopic peaks in
overlapping clusters.
• Does not consider noise peaks that exhibit the mass, but
not the area of an expected isotope peak.
• Amplifies the intensity of monoisotopic masses at high
m/z (due to contribution from other peaks in the cluster),
which allows the peak detection thresholds to eliminate
chemical noise without eliminating the high m/z peaks of
interest, enables improved peak matching in calibration,
and provides better results in database searching (which
relies on monoisotopic masses).