Voyager Data Examples
Data Explorer
™
Software User’s Guide 7-17
7
Matching peaks 5. Click Match Peaks and Solve. The software compares
observed masses in the spectrum to reference masses in
the selected reference file, lists the matches in the Peak
Matched list, calibrates the spectrum, and displays the
calibration statistics in the Output window.
NOTE: If you set Mass Tolerance too low, no peaks will
match.
You can also add peaks to the Peak Matched list by
right-click-dragging on a peak in the spectrum, then
selecting the mass from the reference Peak Information
dialog displayed. Click Solve and Plot after manually
adding masses.
The spectrum is calibrated and displayed with an MC
trace label. The calibration statistics are displayed in
the Output window.
Applying 6. If the calibration statistics are acceptable, click Apply
Calibration.
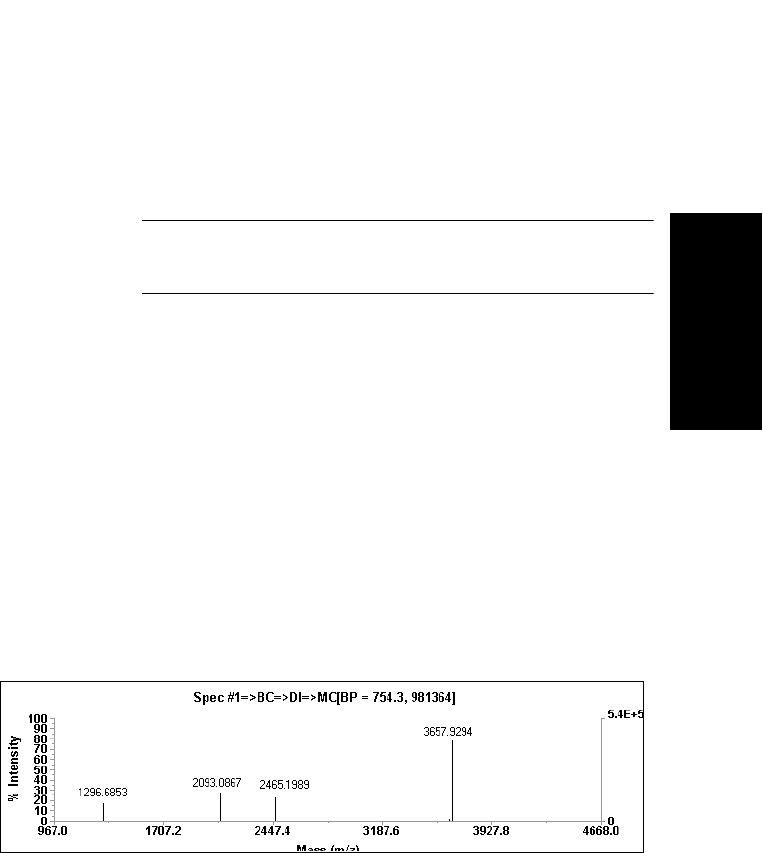
Figure 7-17 shows the deisotoped spectrum after calibration,
with improved mass accuracy.
Figure 7-17 Deisotoped Spectrum After Calibration


