


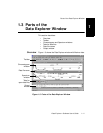

Parts of the Data Explorer Window
Data Explorer
™
Software User’s Guide 1-15
1
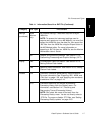
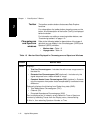
Output window The Output window (see Figure 1-3 on page 1-11) displays
tabs at the bottom that you can click to switch between the
types of information displayed:
Output window
tabs
• Result—Displays results generated using commands on
the Process, Tools, and Applications menus. For more
information on results, see:
• Section 5.3, Manual Calibration, or Section 5.4,
Automatic Calibration
• Section 5.6, Mass Deconvolution (Mariner Data
Only)
• Section 6.2, Using the Isotope Calculator
• Section 6.3, Using the
Mass Resolution Calculator
• Section 6.4, Using the Signal-to-Noise Ratio
Calculator
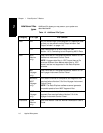
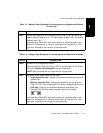
• Chro Peak List —Displays results of chromatogram
peak detection and integration. For more information,
see Section 3.3, Peak List.
• Spectrum Peak List—Displays results of spectrum
peak detection, integration, and centroiding. For more
information, see Section 3.3, Peak List.
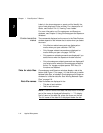
• Sample Info—For data files, displays the:
• Software version used for acquisition
• Acquisition time and sample comments entered
when data was acquired
For result files (.RCT, .RST, .RCD, .RSD), displays any
processing functions that have been performed and
saved in the result file.