Viewing Results
CTS 710 SONET Test Set User Manual
3–177
The Errors category of the MAIN RESULTS page displays results in
three ways. The first way displays the count for each type of error.
The second way displays the error ratio for each error. The third way
displays the number of errored seconds that occurred for each type of
error during the test.
The Failures category of the MAIN RESULTS page displays the
number of seconds that the failure occurred.
The Alarms category of the MAIN RESULTS page displays the
number of seconds that the alarm occurred.
The Pointers category of the MAIN RESULTS page displays the
number of seconds certain conditions existed and the number of
times certain actions occurred.
Displaying an Analysis of Test Results
To display an analysis of test results:
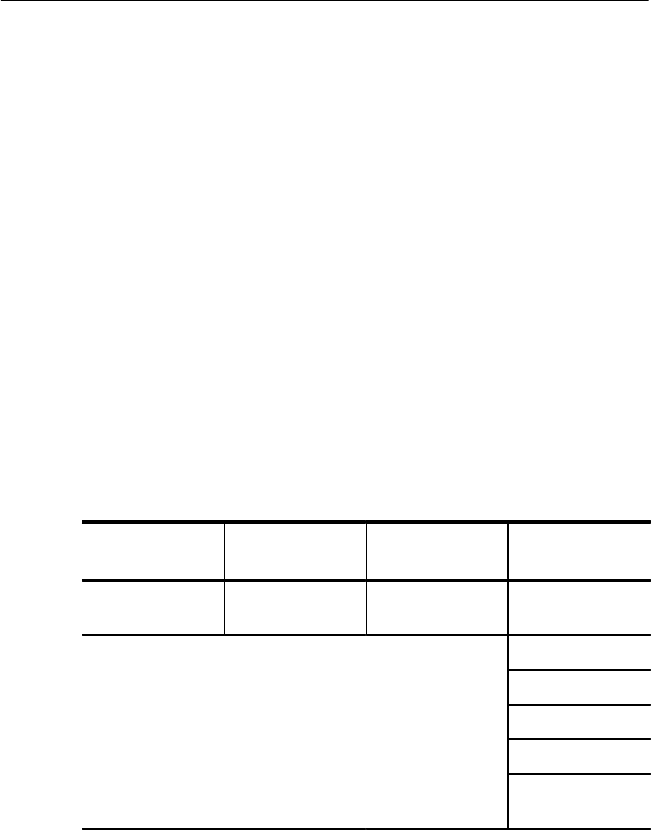
Press Menu
Button
Select Menu
Page
Highlight
Parameter
Select Choice
RESULTS ERROR
ANALYSIS
none Section
Line
Path Analysis
VT Analysis
Pattern Analysis
DSn Path
Analysis
Tables 3–24 through 3–30 detail the error analysis that appears on
the ERROR ANALYSIS page. With the exception of the error count,
the analysis of the error conditions that appear on the ERROR
ANALYSIS page is made up of two numbers. The first number is the
number of seconds the condition existed. The second number is the
percentage of the test duration that the condition existed.
Viewing Results
CTS 710 SONET Test Set User Manual
3–177
The Errors category of the MAIN RESULTS page displays results in
three ways. The first way displays the count for each type of error.
The second way displays the error ratio for each error. The third way
displays the number of errored seconds that occurred for each type of
error during the test.
The Failures category of the MAIN RESULTS page displays the
number of seconds that the failure occurred.
The Alarms category of the MAIN RESULTS page displays the
number of seconds that the alarm occurred.
The Pointers category of the MAIN RESULTS page displays the
number of seconds certain conditions existed and the number of
times certain actions occurred.
Displaying an Analysis of Test Results
To display an analysis of test results:
Press Menu
Button
Select Menu
Page
Highlight
Parameter
Select Choice
RESULTS ERROR
ANALYSIS
none Section
Line
Path Analysis
VT Analysis
Pattern Analysis
DSn Path
Analysis
Tables 3–24 through 3–30 detail the error analysis that appears on
the ERROR ANALYSIS page. With the exception of the error count,
the analysis of the error conditions that appear on the ERROR
ANALYSIS page is made up of two numbers. The first number is the
number of seconds the condition existed. The second number is the
percentage of the test duration that the condition existed.


