


Viewing Results
3–186
CTS 710 SONET Test Set User Manual
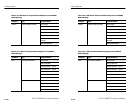
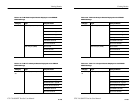
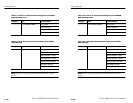
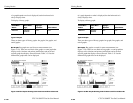
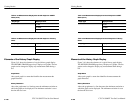
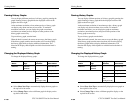
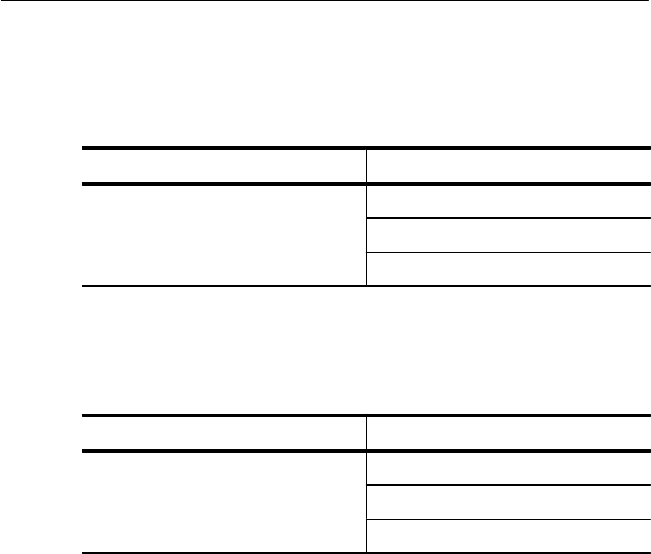
Table 3–33: Measurements Displayed as On/Off Graphs for SONET
Rates (Cont.)
Graph Type Displayed Value
VT AIS
VT FERF
Pattern
Table 3–34: Measurements Displayed as On/Off Graphs for Tributary
Rates
Graph Type Displayed Value
DSn Alarms Idle
AIS
Yellow
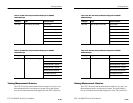
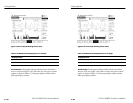
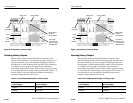
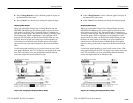
Elements of the History Graph Display
Figure 3–61 shows the elements of a typical history graph display.
The HISTORY GRAPHS page always displays two graphs. The two
graphs can be changed to display any measurement taken during a
test.
Graph Name
Above each graph is a name that identifies the measurement the
graph illustrates.
History Resolution
Above the graph name is a line that states the minimum resolution at
which the graph can be displayed. The minimum resolution is set at
the time the test is run.
Viewing Results
3–186
CTS 710 SONET Test Set User Manual
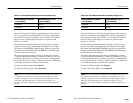
Table 3–33: Measurements Displayed as On/Off Graphs for SONET
Rates (Cont.)
Graph Type Displayed Value
VT AIS
VT FERF
Pattern
Table 3–34: Measurements Displayed as On/Off Graphs for Tributary
Rates
Graph Type Displayed Value
DSn Alarms Idle
AIS
Yellow
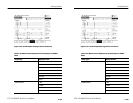
Elements of the History Graph Display
Figure 3–61 shows the elements of a typical history graph display.
The HISTORY GRAPHS page always displays two graphs. The two
graphs can be changed to display any measurement taken during a
test.
Graph Name
Above each graph is a name that identifies the measurement the
graph illustrates.
History Resolution
Above the graph name is a line that states the minimum resolution at
which the graph can be displayed. The minimum resolution is set at
the time the test is run.