


Viewing Results
CTS 710 SONET Test Set User Manual
3–183
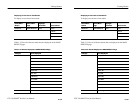
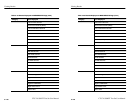
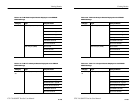
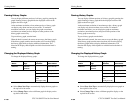
Table 3–31: Measurements Displayed as Bar Graphs
Measurement
Section B1 Error Counts
Section B1 Errored Secs
Line B2 Error Counts
Line B2 Errored Secs
Line FEBE Error Counts
Path B3 Error Counts
Path B3 Errored Secs
Path FEBE Error Counts
Pattern Error Counts
Pattern Errored Secs
STS Pointer Justifications
VT Pointer Justifications
VT BIP2 Errors
VT BIP2 Errored Secs
VT FEBE Error Count
VT FEBE Errored Secs
CRC/Parity Errored Seconds
Frame Errored Seconds
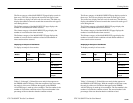
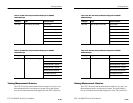
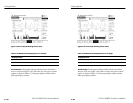
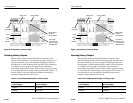
Line Graphs. A line graph is used to display pointer movement
history (see Figure 3–59). The vertical axis of the line graph ranges
from 0 to the maximum, which is different for SPEs and VTs. There
is only one measurement displayed as a line graph, as shown in
Table 3–32.
Viewing Results
CTS 710 SONET Test Set User Manual
3–183
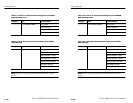
Table 3–31: Measurements Displayed as Bar Graphs
Measurement
Section B1 Error Counts
Section B1 Errored Secs
Line B2 Error Counts
Line B2 Errored Secs
Line FEBE Error Counts
Path B3 Error Counts
Path B3 Errored Secs
Path FEBE Error Counts
Pattern Error Counts
Pattern Errored Secs
STS Pointer Justifications
VT Pointer Justifications
VT BIP2 Errors
VT BIP2 Errored Secs
VT FEBE Error Count
VT FEBE Errored Secs
CRC/Parity Errored Seconds
Frame Errored Seconds
Line Graphs. A line graph is used to display pointer movement
history (see Figure 3–59). The vertical axis of the line graph ranges
from 0 to the maximum, which is different for SPEs and VTs. There
is only one measurement displayed as a line graph, as shown in
Table 3–32.