Viewing Results
CTS 710 SONET Test Set User Manual
3–181
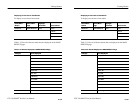
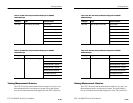
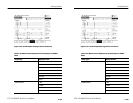
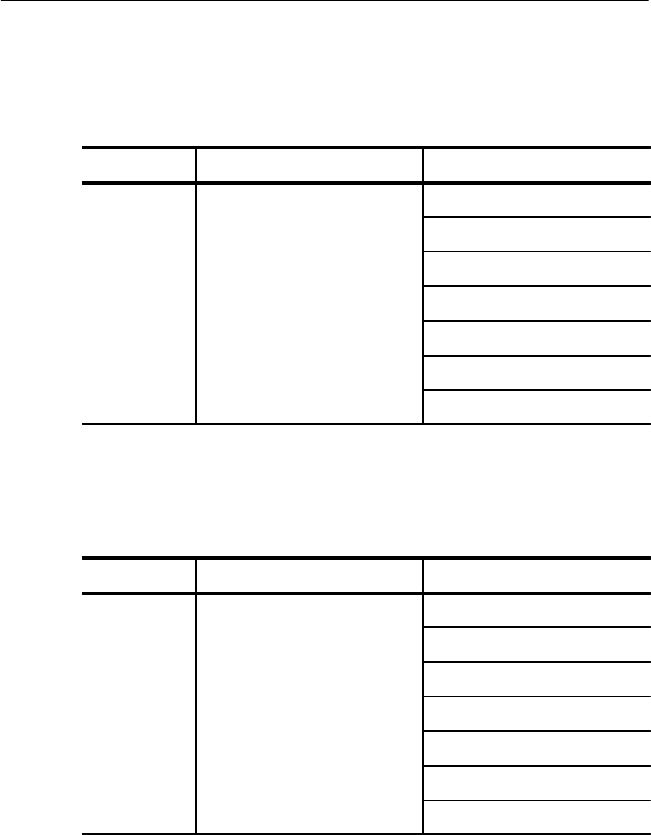
Table 3–29: DS1 Path Analysis Results Displayed on ERROR
ANALYSIS Page
Category Type Analysis Result
DS1 Path DS1 Analysis (Frame Bit) Error Counts
Errored Seconds
Errored Seconds – Type A
Errored Seconds – Type B
Severely Errored Seconds
Unavailable Seconds
Error Free Seconds
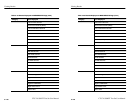
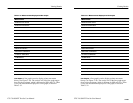
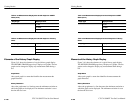
Table 3–30: DS3 Path Analysis Results Displayed on ERROR
ANALYSIS Page
Category Type Analysis Result
DS3 Path DS3 Analysis (P-Bit Parity) Error Counts
Errored Seconds
Errored Seconds – Type A
Errored Seconds – Type B
Severely Errored Seconds
Unavailable Seconds
Error Free Seconds
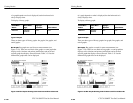
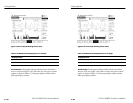
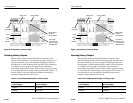
Viewing Measurement Histories
The CTS 710 records measurement histories whenever you run a test.
Measurement histories are displayed as graphs. The graph displays
how an individual measurement changed over time. The vertical axis


