Viewing Results
CTS 710 SONET Test Set User Manual
3–189
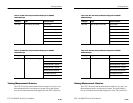
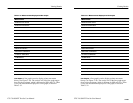
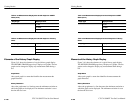
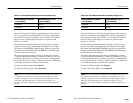
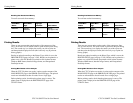
Table 3–35: Time Represented by Bars on History Graph (Cont.)
History Resolution = Normal
(1 min samples)
History Resolution = Low
(15 min samples)
15 minutes 4 hours
60 minutes 12 hours
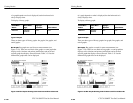
There are 56 intervals of a history graph displayed on the screen at a
time. At a resolution of one minute per bar, a history graph displays
test results for a period of 56 minutes. At a resolution of 15 minutes
per bar, a history graph displays test results for a period of 840
minutes, or 14 hours.
The minimum test duration required to display results on a history
graph is one minute. Tests shorter than one minute will not display
any results on the HISTORY GRAPHS page. However, test results
do appear on the MAIN RESULTS and ERROR ANALYSIS pages
for tests shorter than one minute.
The longest period for which test results are displayed is 72 hours
(3 days) at a History Resolution of 1 minute or 1080 hours (45 days)
at a History Resolution of 15 minutes. If you run a test continuously,
only results for the last 72 hours (1 minute resolution) or 1080 hours
(15 minutes resolution) are maintained in memory.
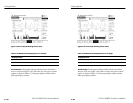
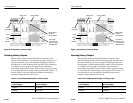
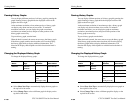
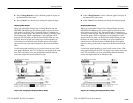
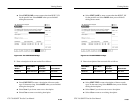
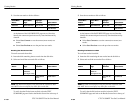
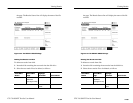
To zoom in a history graph, select Zoom In.
To zoom out a history graph, select Zoom Out.
NOTE. When viewing long test durations (for example, three days) at
a resolution of one minute, you might see a timestamp error. For
example, you might see two one-minute intervals stamped with the
same time. The timestamp error is simply revealing the clock
accuracy. The correct number of intervals for the test duration are
present.


