


Viewing Results
3–190
CTS 710 SONET Test Set User Manual
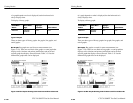
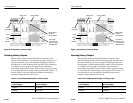
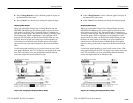
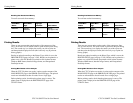
Panning History Graphs
You can display different portions of a history graph by panning the
graph. Panning a history graph shifts the displayed section of the
graph to the left or right.
At the maximum resolution of one minute per bar, a history graph
can display only about one hour of test results. To maintain
maximum resolution, you can display the graph at maximum
resolution (one minute per bar) and pan to other portions of the
history graph as necessary.
To pan a history graph, turn the knob.
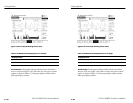
When the knob is turned, the cursor moves across the history graph.
If the history graph contains more data than will fit on the display,
the history graph shifts to display additional information. The
direction the display shifts depends on which direction the knob is
turning.
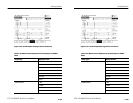
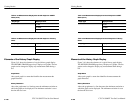
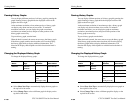
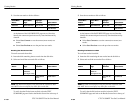
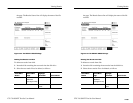
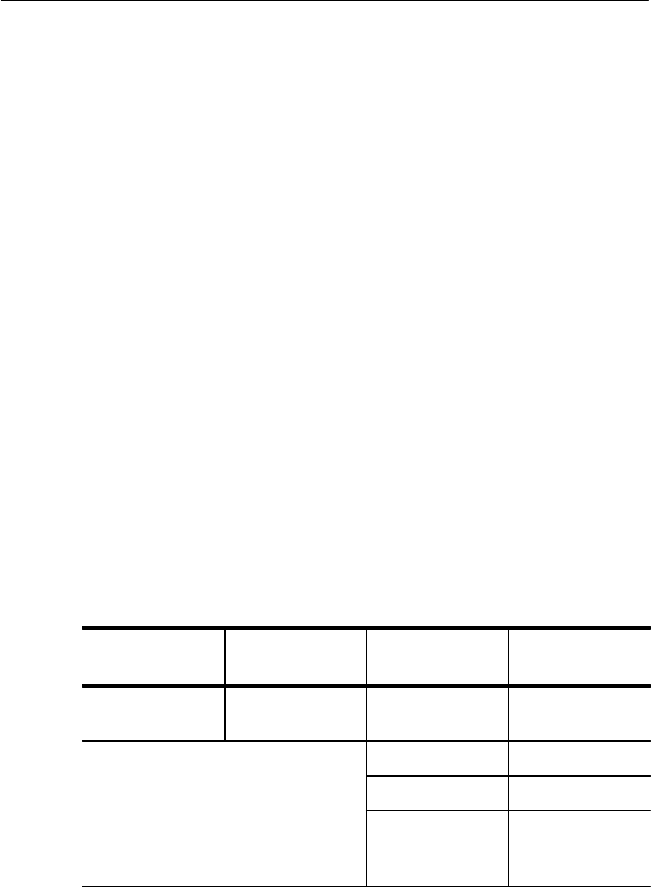
Changing the Displayed History Graph
To change the displayed history graph:
Press Menu
Button
Select Menu
Page
Highlight
Parameter
Select Choice
RESULTS HISTORY
GRAPHS
Show Next Top
Change Top
Change Bottom
select graph with
knob
(see Figure 3–62)
Select Graph
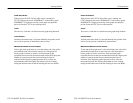
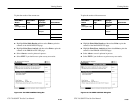
H Select Show Next Top to automatically display the next graph on
the top half of the screen.
H Select Change Top to select a different graph for display on the
top half of the screen.
Viewing Results
3–190
CTS 710 SONET Test Set User Manual
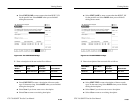
Panning History Graphs
You can display different portions of a history graph by panning the
graph. Panning a history graph shifts the displayed section of the
graph to the left or right.
At the maximum resolution of one minute per bar, a history graph
can display only about one hour of test results. To maintain
maximum resolution, you can display the graph at maximum
resolution (one minute per bar) and pan to other portions of the
history graph as necessary.
To pan a history graph, turn the knob.
When the knob is turned, the cursor moves across the history graph.
If the history graph contains more data than will fit on the display,
the history graph shifts to display additional information. The
direction the display shifts depends on which direction the knob is
turning.
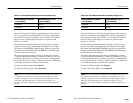
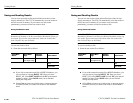
Changing the Displayed History Graph
To change the displayed history graph:
Press Menu
Button
Select Menu
Page
Highlight
Parameter
Select Choice
RESULTS HISTORY
GRAPHS
Show Next Top
Change Top
Change Bottom
select graph with
knob
(see Figure 3–62)
Select Graph
H Select Show Next Top to automatically display the next graph on
the top half of the screen.
H Select Change Top to select a different graph for display on the
top half of the screen.