


Viewing Results
3–182
CTS 710 SONET Test Set User Manual
of a graph depends on what is displayed, but the horizontal axis
always displays time.
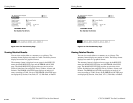
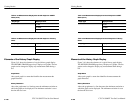
To display a history graph:
Press Menu
Button
Select Menu
Page
Highlight
Parameter
Select Choice
RESULTS HISTORY
GRAPHS
none none
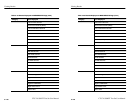
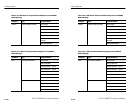
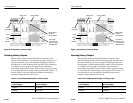
Types of Graphs
There are three types of history graphs: bar graphs, line graphs, and
on/off graphs.
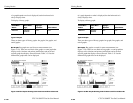
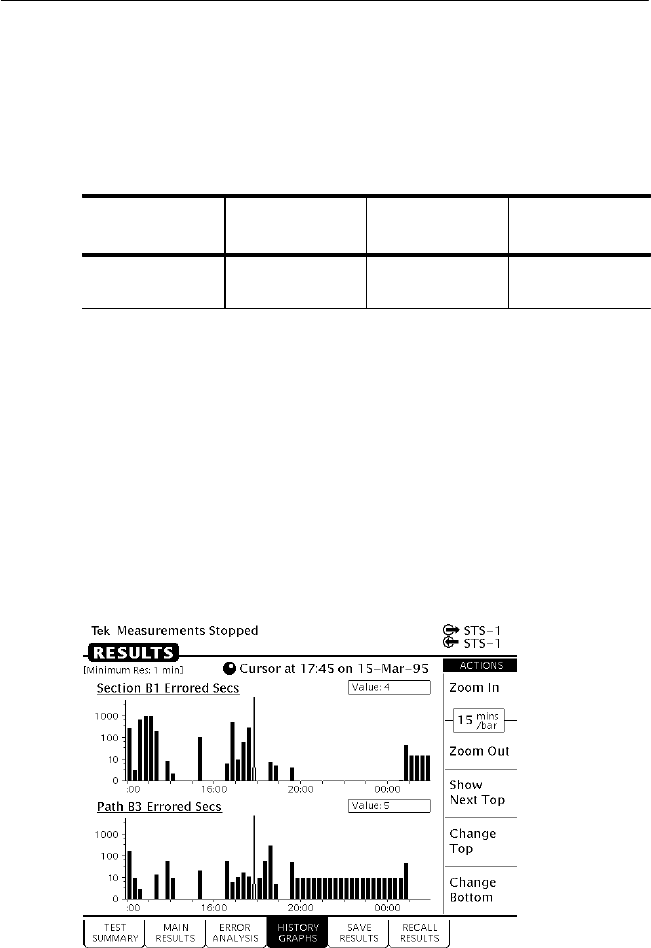
Bar Graphs. Bar graphs are used for most measurements (see
Figure 3–58). There are two kinds of bar graphs: a count graph that
displays code violations and pointer justifications and an errored
seconds graph that displays errored seconds. Table 3–31 lists the
different bar graphs that can be displayed.
Figure 3–58: Bar Graphs Showing Code Violations and Errored Seconds
Viewing Results
3–182
CTS 710 SONET Test Set User Manual
of a graph depends on what is displayed, but the horizontal axis
always displays time.
To display a history graph:
Press Menu
Button
Select Menu
Page
Highlight
Parameter
Select Choice
RESULTS HISTORY
GRAPHS
none none
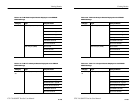
Types of Graphs
There are three types of history graphs: bar graphs, line graphs, and
on/off graphs.
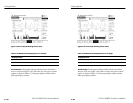
Bar Graphs. Bar graphs are used for most measurements (see
Figure 3–58). There are two kinds of bar graphs: a count graph that
displays code violations and pointer justifications and an errored
seconds graph that displays errored seconds. Table 3–31 lists the
different bar graphs that can be displayed.
Figure 3–58: Bar Graphs Showing Code Violations and Errored Seconds