


Viewing Results
CTS 710 SONET Test Set User Manual
3–187
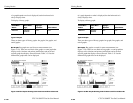
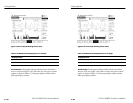
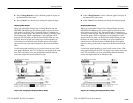
Power Out Indicator
If the power to the CTS 710 fails while a test is running, the
CTS 710 displays the words “POWEROUT” on the history graph.
POWEROUT is displayed vertically on the graph and spans the
period of time the CTS 710 was without power.
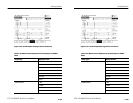
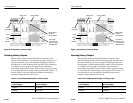
Cursor
The cursor is a line that is scrolled across the graph using the knob.
Cursor Position
Just below the menu name is a line that identifies the position of the
cursor. Cursor position is identified by time and date.
Measurement Results at Cursor Position
To the right of the graph name is a box that displays the value of the
measurement at the cursor location (the box is not displayed for
history graphs of alarms or failures). If the displayed graph
represents errored seconds, the measurement results box displays the
number of errored seconds that occurred during the interval
indicated. If the displayed graph represents an error count, the
measurement results box displays the number of errors counted
during the indicated interval and the resulting bit error rate (BER).
Viewing Results
CTS 710 SONET Test Set User Manual
3–187
Power Out Indicator
If the power to the CTS 710 fails while a test is running, the
CTS 710 displays the words “POWEROUT” on the history graph.
POWEROUT is displayed vertically on the graph and spans the
period of time the CTS 710 was without power.
Cursor
The cursor is a line that is scrolled across the graph using the knob.
Cursor Position
Just below the menu name is a line that identifies the position of the
cursor. Cursor position is identified by time and date.
Measurement Results at Cursor Position
To the right of the graph name is a box that displays the value of the
measurement at the cursor location (the box is not displayed for
history graphs of alarms or failures). If the displayed graph
represents errored seconds, the measurement results box displays the
number of errored seconds that occurred during the interval
indicated. If the displayed graph represents an error count, the
measurement results box displays the number of errors counted
during the indicated interval and the resulting bit error rate (BER).