


Viewing Results
3–184
CTS 710 SONET Test Set User Manual
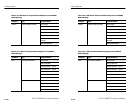
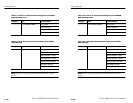
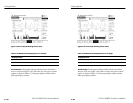
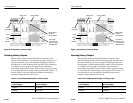
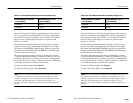
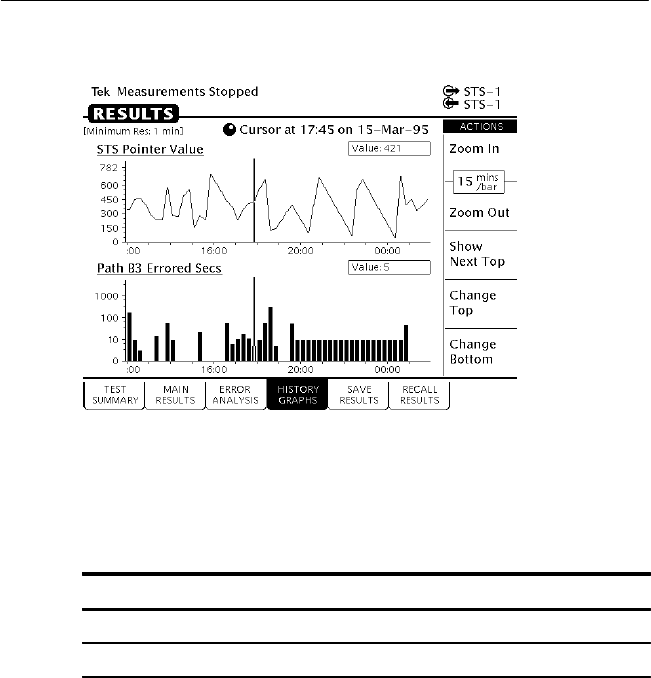
Figure 3–59: Line Graph Showing Pointer Value
Table 3–32: Measurements Displayed as a Line Graph
Displayed Value
STS Pointer Value
VT Pointer Value
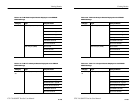
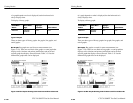
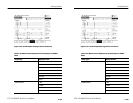
On/Off Graphs. On/off graphs indicate whether alarms and failures
were on or off (see Figure 3–60). There are only two types of on/off
graphs, as shown in Table 3–33. One type displays alarms and the
other type displays failures.
Viewing Results
3–184
CTS 710 SONET Test Set User Manual
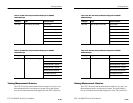
Figure 3–59: Line Graph Showing Pointer Value
Table 3–32: Measurements Displayed as a Line Graph
Displayed Value
STS Pointer Value
VT Pointer Value
On/Off Graphs. On/off graphs indicate whether alarms and failures
were on or off (see Figure 3–60). There are only two types of on/off
graphs, as shown in Table 3–33. One type displays alarms and the
other type displays failures.