


CHAPTER 4 Defining DataWindow Objects
DataWindow Designer User’s Guide 101
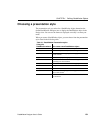
Choosing a presentation style
The presentation style you select for a DataWindow object determines the
format DataWindow Designer uses to display the DataWindow object in the
Design view. You can use the format as displayed or modify it to meet your
needs.
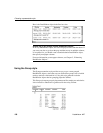
When you create a DataWindow object, you can choose from the presentation
styles listed in the following table.
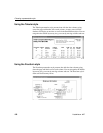
Table 4-1: DataWindow Presentation styles
Using this
DataWindow wizard You create a new DataWindow object
Composite That includes other DataWindow objects
Crosstab With summary data in a spreadsheet-like grid
Freeform With the data columns going down the page and labels next
to each column
Graph With data displayed in a graph
Grid With data in row and column format with grid lines
separating rows and columns
Group With data in rows that are divided into groups
Label That presents data as labels
N-Up With two or more rows of data next to each other
Tabular With data columns going across the page and headers
above each column
TreeView With hierarchical data in rows that are divided into levels
in a TreeView