


CHAPTER 15 Working with Graphs
DataWindow Designer User’s Guide 425
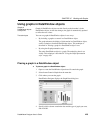
Using graphs in DataWindow objects
Graphs in
DataWindow objects
are dynamic
Graphs in DataWindow objects are tied directly to the data that is in the
DataWindow object. As the data changes, the graph is automatically updated
to reflect the new values.
Two techniques
You can use graphs in DataWindow objects in two ways:
• By including a graph as a control in a DataWindow object
The graph enhances the display of information in a DataWindow object,
such as a tabular or freeform DataWindow object. This technique is
described in "Placing a graph in a DataWindow object" next.
• By using the Graph presentation style
The entire DataWindow object is a graph. The underlying data is not
visible. This technique is described in “Using the Graph presentation
style” on page 439.
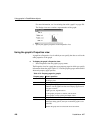
Placing a graph in a DataWindow object
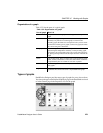
❖ To place a graph in a DataWindow object:
1 Open or create the DataWindow object that will contain the graph.
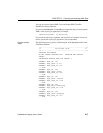
2 Select Insert>Control>Graph from the menu bar.
3 Click where you want the graph.
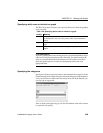
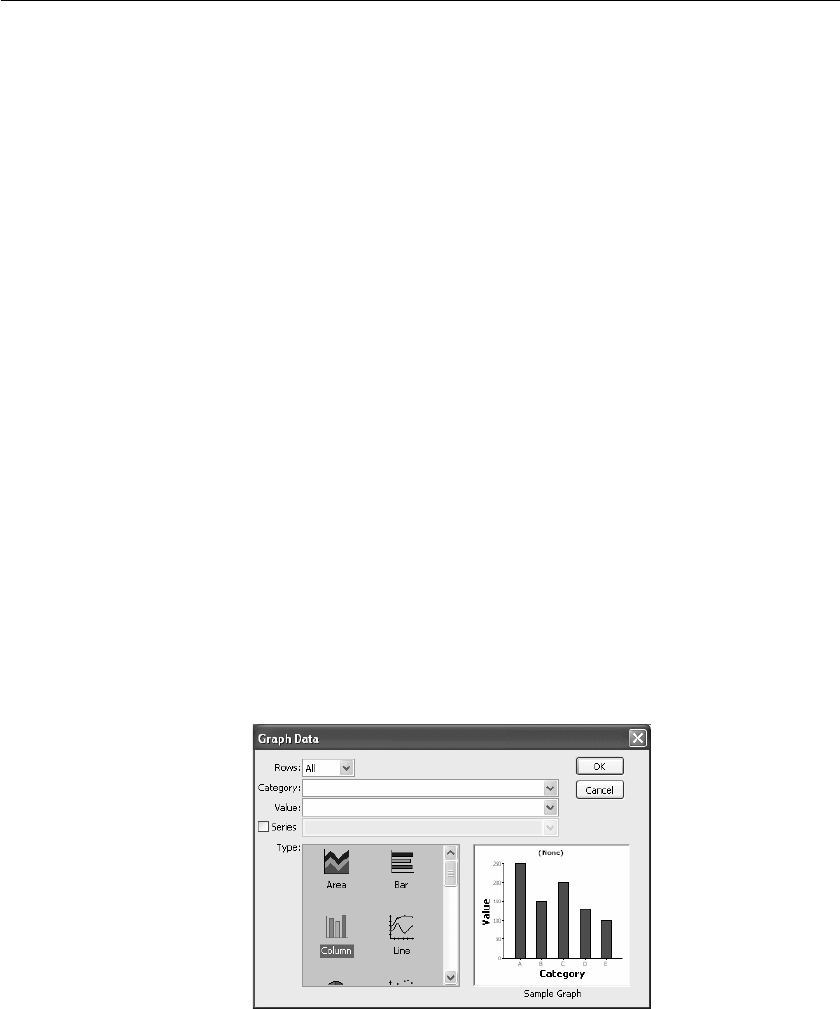
DataWindow Designer displays the Graph Data dialog box:
4 Specify which columns contain the data and the type of graph you want,
and click OK.