CHAPTER 7 Working with Controls in DataWindow Objects
DataWindow Designer User’s Guide 215
Displaying boundaries for controls in a DataWindow object
When reorganizing controls in the Design view, it is sometimes helpful to see
how large all the controls are. That way you can easily check for overlapping
controls and make sure that the spacing around controls is what you want.
❖ To display control boundaries in a DataWindow object:
1 Select Design>Options from the menu bar.
The DataWindow Options dialog box displays.
2 Select the Show Edges check box.
DataWindow Designer displays the boundaries of each control in the
DataWindow object.
Boundaries display only in the Design view
The boundaries displayed for controls are for use only in the Design view. They
do not display in a running DataWindow object or in a printed report.
Using the grid and the ruler in a DataWindow object
The DataWindow painter provides a grid and a ruler to help you align controls.
❖ To use the grid and the ruler:
1 Select Design>Options from the menu bar.
The DataWindow Options dialog box displays. The Alignment Grid box
contains the alignment grid options.
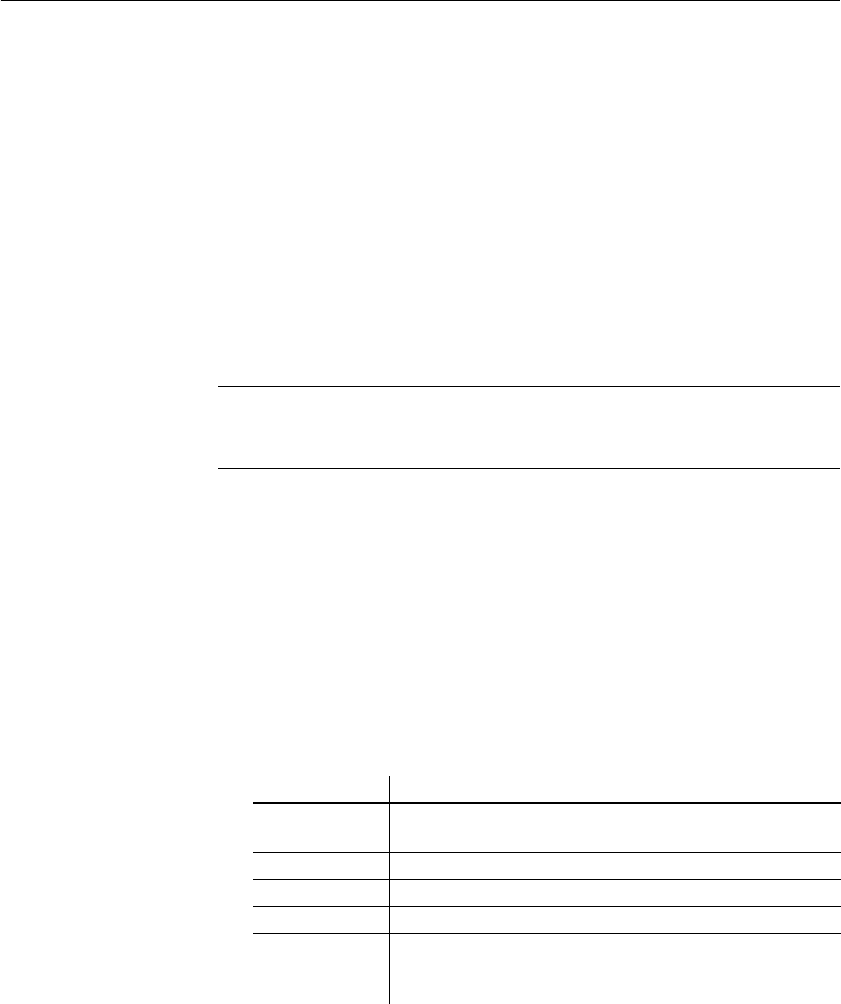
2 Use the options as needed:
Your choices for the grid and the ruler are saved and used the next time
you start DataWindow Designer.
Option Meaning
Snap to Grid Make controls snap to a grid position when you place them
or move them.
Show Grid Show or hide the grid when the workspace displays.
X Specify the size (width) of the grid cells.
Y Specify the size (height) of the grid cells.
Show Ruler Show a ruler. The ruler uses the units of measurement
specified in the Style dialog box. See “Changing the
DataWindow object style” on page 171.


