


CHAPTER 15 Working with Graphs
DataWindow Designer User’s Guide 439
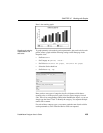
Using the Graph presentation style
Instead of embedding a graph in a DataWindow object, you can use the Graph
presentation style to create a DataWindow object that is only a graph—the
underlying data is not displayed.
One advantage of the Graph presentation style is that the graph resizes
automatically if users resize the DataWindow control associated with the graph
DataWindow object at runtime.
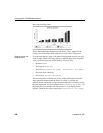
❖ To use the Graph presentation style:
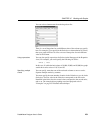
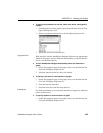
1 Select File>New from the menu bar.
The New dialog box displays.
2 Select the DataWindow tab, select the Graph presentation style, and click
OK.
3 Specify the data source for the DataWindow object. If you want data to be
retrieved into the Preview view automatically, select the Retrieve on
Preview check box.
For more information, see Chapter 4, “Defining DataWindow Objects.”
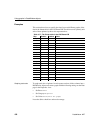
4 Enter the definitions for the series, categories, and values, as described in
“Associating data with a graph” on page 428, and click Next.
Note that when using the Graph presentation style, the graph always
graphs all rows; you cannot specify page or group.
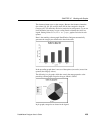
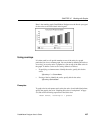
5 Enter a title for the graph, select a graph type, and click Next.
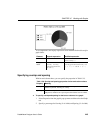
6 Review your specifications and click Finish.
A model of the graph displays in the Design view.
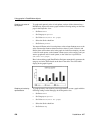
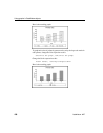
7 Specify the properties of the graph, as described in "Defining a graph's
properties" next.
8 Save the DataWindow object in a library.
9 Associate the graph DataWindow object with a DataWindow control on a
form.
At runtime, the graph fills the entire control and resizes when the control
is resized.