


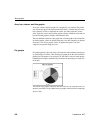
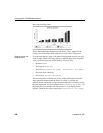

Using graphs in DataWindow objects
430 DataWindow .NET
Using display values of data
If you are graphing columns that use code tables, when data is stored with a
data value but displayed to users with more meaningful display values, by
default the graph uses the column's data values. To have the graph use a
column's display values, use the
LookupDisplay DataWindow expression
function when specifying Category or Series.
LookupDisplay returns a string
that matches the display value for a column:
LookupDisplay ( column )
For more about code tables, see “Defining a code table” on page 251. For more
about LookupDisplay, see the DataWindow Object Reference.
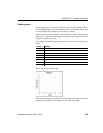
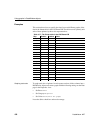
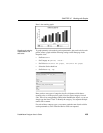
Specifying the values
DataWindow Designer populates the Value drop-down list. The list includes
the names of all the retrieved columns as well as the following aggregate
functions:
• Count for all non-numeric columns
• Sum for all numeric columns
Select an item from the drop-down list or type an expression (in the Properties
view). For example, if you want to graph the sum of units sold, you can specify:
sum(units for graph)
To graph 110 percent of the sum of units sold, you can specify:
sum(units*1.1 for graph)
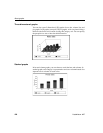
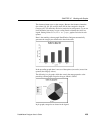
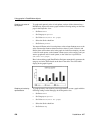
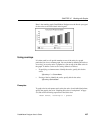
Specifying the series
Graphs can have one or more series.
Single-series graphs
If you want only one series (that is, if you want to graph all retrieved rows as
one series of values), leave the Series box empty.
Multiple-series graphs
If you want to graph more than one series, select the Series check box and
specify the column that will provide the series values.