


CHAPTER 4 Defining DataWindow Objects
DataWindow Designer User’s Guide 103
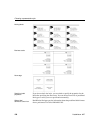
Using the Grid style
The Grid presentation style shows data in row-and-column format with grid
lines separating rows and columns. With other styles, you can move text,
values, and other objects around freely in designing the report. With the grid
style, the grid lines create a rigid structure of cells.
An advantage of the Grid style is that users can reorder and resize columns at
runtime.
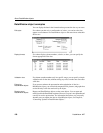
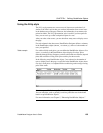
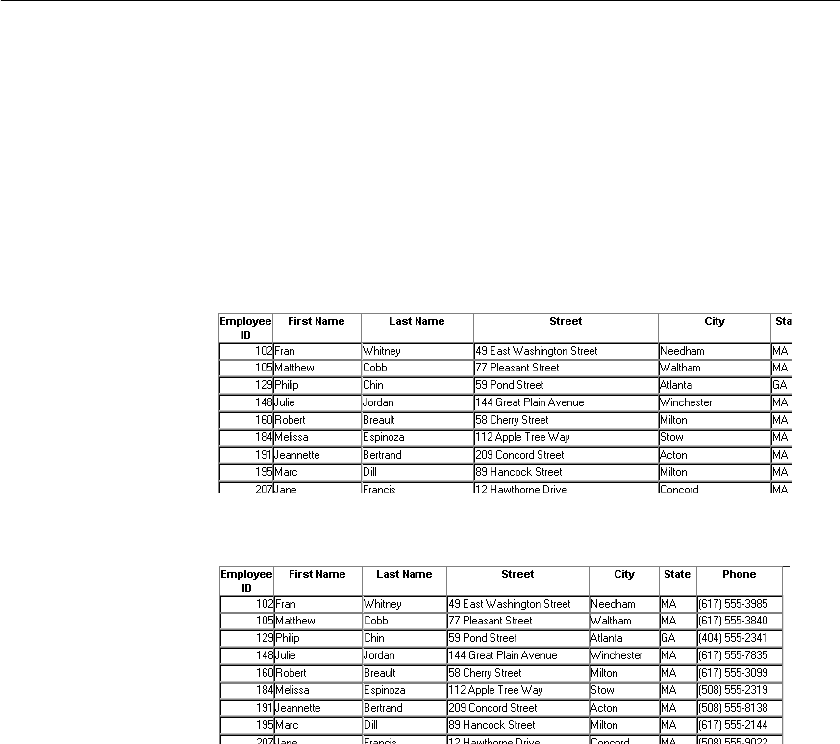
Original Grid report
This grid report shows employee information. Several of the columns have a
large amount of extra white space:
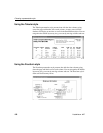
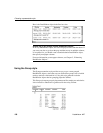
Grid report with
modified column
widths
This grid report was created from the original one by decreasing the width of
some columns:
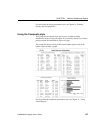
Using the Label style
The Label presentation style shows data as labels. With this style you can
create mailing labels, business cards, name tags, index cards, diskette labels,
file folder labels, and many other types of labels.