Using graphs in DataWindow objects
428 DataWindow .NET
3 Select the settings for the following options on the General property page:
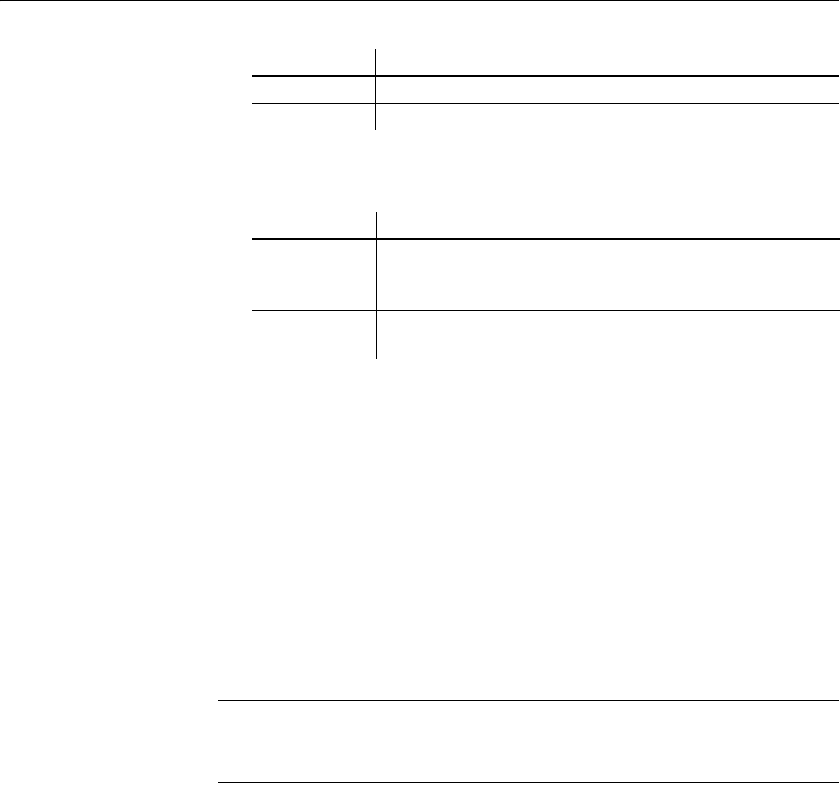
Table 15-5: Size and position settings on the General property page
Associating data with a graph
When using a graph in a DataWindow object, you associate axes of the graph
with columns in the DataWindow object.
The only way to get data into a graph in a DataWindow object is through
columns in the DataWindow object. You cannot add, modify, or delete data in
the graph except by adding, modifying, or deleting data in the DataWindow
object.
You can graph data from any columns retrieved into the DataWindow object.
The columns do not have to be displayed.
About the examples
The process of specifying data for a graph is illustrated below using the Printer
table in the EAS Demo DB.
❖ To specify data for a graph:
1 If you are creating a new graph, the Graph Data dialog box displays.
Otherwise, select Properties from the graph's pop-up menu and select the
Data tab in the Properties view.
2 Fill in the boxes as described in the sections that follow, and click OK.
X, Y The location of the upper-left corner of the graph.
Width, Height The width and height of the graph.
Setting Meaning
Setting Meaning
Size To
Display
The graph fills the DataWindow object and resizes when users
resize the DataWindow object. This setting is used with the
Graph presentation style.
HideSnaked Do not repeat graph after the first column in a DataWindow
object using newspaper-style columns.
