


Choosing a presentation style
108 DataWindow .NET
Using the Graph and Crosstab styles
In addition to the (preceding) text-based presentation styles, DataWindow
Designer provides two styles that allow you to display information graphically:
Graph and Crosstab.
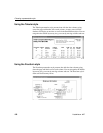
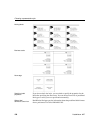
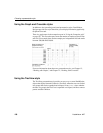
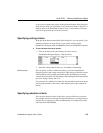
There is a graph report in the composite report in “Using the Composite style”
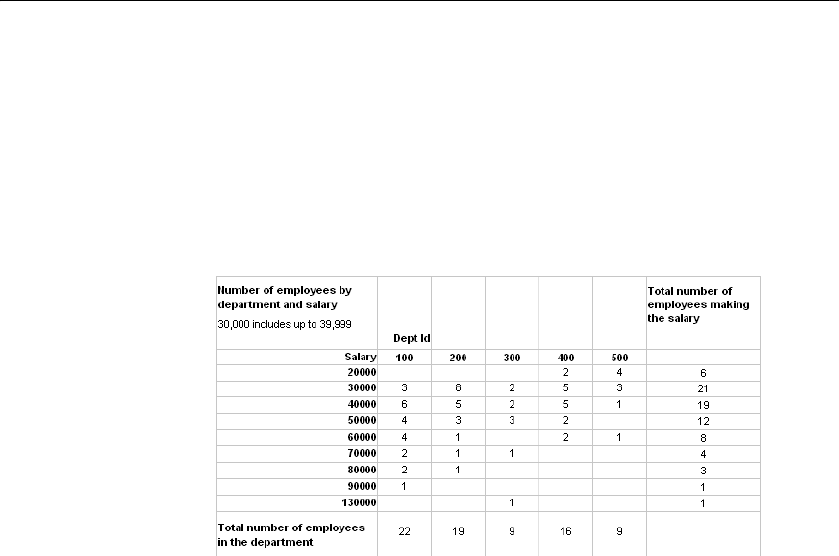
on page 107. This crosstab report counts the number of employees that fit into
each cell. For example, there are three employees in department 100 who make
between $30,000 and $39,999:
For more information about these two presentation styles, see Chapter 15,
“Working with Graphs,” and Chapter 12, “Working with Crosstabs.”
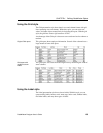
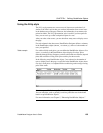
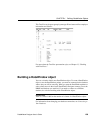
Using the TreeView style
The TreeView presentation style provides an easy way to create DataWindow
objects that display hierarchical data in a TreeView, where the rows are divided
into groups that can be expanded and collapsed. Icons (+ or –) show whether
the state of a group in the TreeView is expanded or collapsed, and lines connect
parents and their children.