


CHAPTER 9 Filtering, Sorting, and Grouping Rows
DataWindow Designer User’s Guide 279
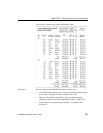
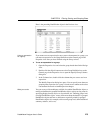
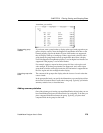
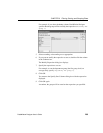
At runtime, you see this:
Suppressing group
headers
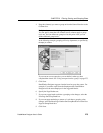
If you do not want a group header to display at the top of each page when you
print or display a report, select the Suppress Group Header check box on the
General property page for the header. If none of the headers are suppressed,
they all display at the top of each page. When a page break coincides with a
group break, the group header and any group headers that follow it display
even if the Suppress Group Header property is set, but higher level headers are
suppressed if the property is set for those headers.
For example, suppose a report has three groups: division, sales region, and
sales manager. If all three group headers are suppressed, and a sales region
group break coincides with a page break, the division header is suppressed but
the sales region and sales manager headers display.
Using the group trailer
band
The contents of the group trailer display after the last row for each value that
causes a break.
In the group trailer band, you specify the information you want displayed after
the last line of identical data for each value in the group. Typically, you include
summary statistics here, as described next.
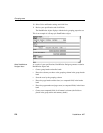
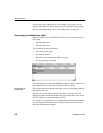
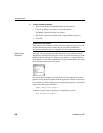
Adding summary statistics
One of the advantages of creating a grouped DataWindow object is that you can
have DataWindow Designer calculate statistics for each group. To do that, you
place computed fields that reference the group. Typically, you place these
computed fields in the group's trailer band.