


Associating data with a crosstab
340 DataWindow .NET
Columns that use code tables
If you specify columns in the database that use code tables, where data is stored
with a data value but displayed with more meaningful display values, the
crosstab uses the column’s display values, not the data values. For more
information about code tables, see Chapter 8, “Displaying and Validating
Data.”
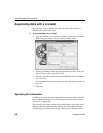
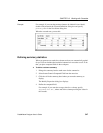
Specifying the values
Each cell in a crosstab holds a value. You specify that value in the Values box.
Typically you specify an aggregate function, such as
Sum or Avg, to summarize
the data. At runtime, each cell has a calculated value based on the function you
provide here and the column and row values for the particular cell.
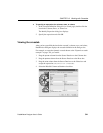
❖ To specify the crosstab’s values:
1 Drag the database column from the Source Data box into the Values box.
DataWindow Designer displays an aggregate function for the value. If the
column is numeric, DataWindow Designer uses
Sum. If the column is not
numeric, DataWindow Designer uses
Count.
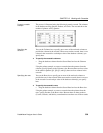
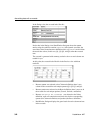
2 If you want to use an aggregate function other than the one suggested by
DataWindow Designer, double-click the item in the Values box and edit
the expression. You can use any of the other aggregate functions supported
in the DataWindow painter, such as
Max, Min, and Avg.
Using the printer example, you would drag the Units column into the Values
box and accept the expression
sum(units for crosstab).
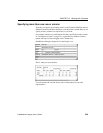
Using expressions
Instead of simply specifying database columns, you can use any valid
DataWindow expression to define the columns, rows, and values used in the
crosstab. You can use any DataWindow expression function in the expression.
For example, say a table contains a
date column named SaleDate, and you want
a column in the crosstab for each month. You could enter the following
expression for the Columns definition:
Month(SaleDate)
The Month function returns the integer value (1–12) for the specified month.
Using this expression, you get columns labeled 1 through 12 in the crosstab.
Each database row for January sales is evaluated in the column under 1, each
database row for February sales is evaluated in the column under 2, and so on.