


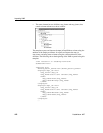

About graphs
420 DataWindow .NET
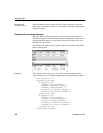
Parts of a graph
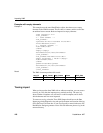
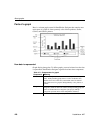
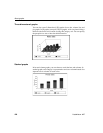
Here is a column graph created in DataWindow Designer that contains most
major parts of a graph. It shows quarterly sales of three products: Stellar,
Cosmic, and Galactic printers:
How data is represented
Graphs display data points. To define graphs, you need to know how the data
is represented. DataWindow Designer organizes data into three components.
Table 15-1: Components of a graph
Component Meaning
Series
A set of data points Each set of related data points makes up one
series. In the preceding graph, there is a series for Stellar sales,
another series for Cosmic sales, and another series for Galactic
sales. Each series in a graph is distinguished by color, pattern, or
symbol.
Categories
The major divisions of the data Series data are divided into
categories, which are often non-numeric. In the preceding graph, the
series are divided into four categories: Q1, Q2, Q3, and Q4.
Categories represent values of the independent variable(s).
Values The values for the data points (dependent variables).