


Using graphs in DataWindow objects
434 DataWindow .NET
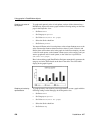
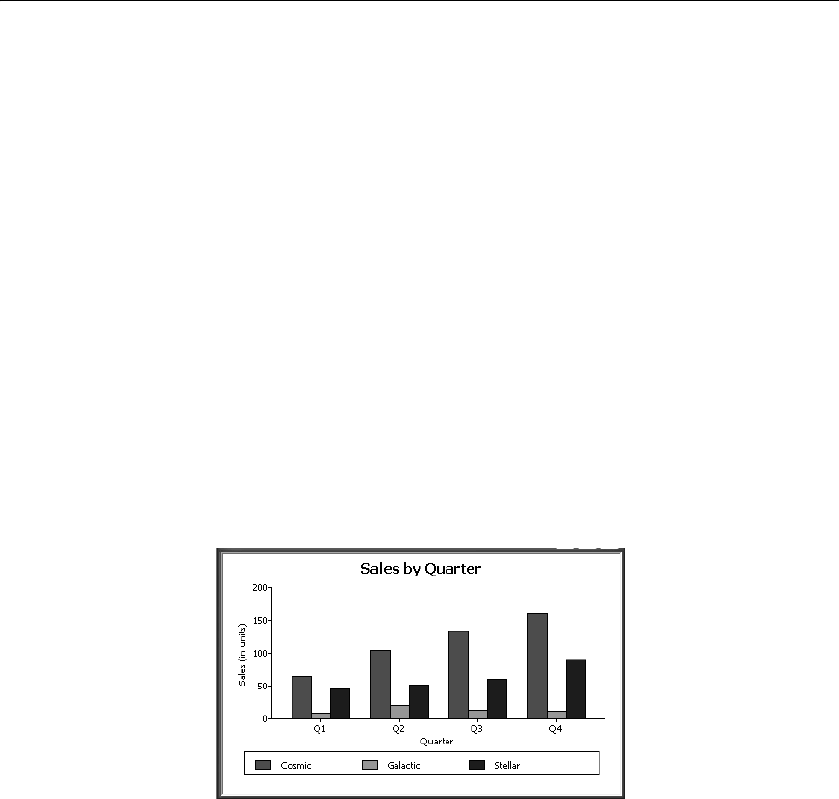
Graphing unit sales of
each printer
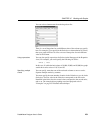
To graph total quarterly sales of each printer, retrieve all the columns into a
DataWindow object and create a graph with the following settings on the Data
page in the Properties view:
•Set Rows to
All
•Set Category to quarter
• Set Value to sum(units for graph)
• Select the Series check box
• Set Series to
product
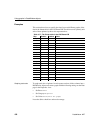
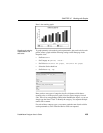
You want a different series for each printer, so the column Product serves as the
series. Because the
Product column has three values (Cosmic, Galactic, and
Stellar), there will be three series in the graph. As in the first example, you want
a value for each quarter, so the
Quarter column serves as the category, and you
want to graph total sales in each quarter, so the Value box is specified as
sum(units for graph).
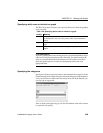
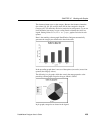
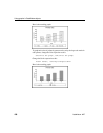
Here is the resulting graph. DataWindow Designer automatically generates the
category and series labels based on the data in the table. The series labels
display in the graph's legend:
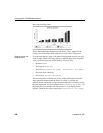
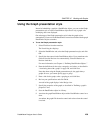
Graphing unit sales by
representative
To graph quarterly sales made by each representative, create a graph with the
following settings on the Data page in the Properties view:
•Set Rows to
All
•Set Category to quarter
• Set Value to sum(units for graph)
• Select the Series check box
• Set Series to
rep