


CHAPTER 15 Working with Graphs
DataWindow Designer User’s Guide 421
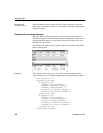
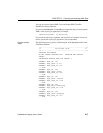
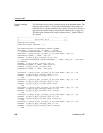
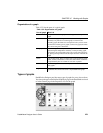
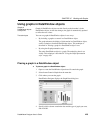
Organization of a graph
Table 15-2 lists the parts of a typical graph.
Table 15-2: Organization of a graph
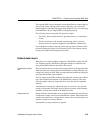
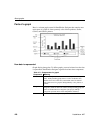
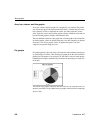
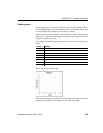
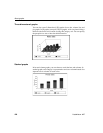
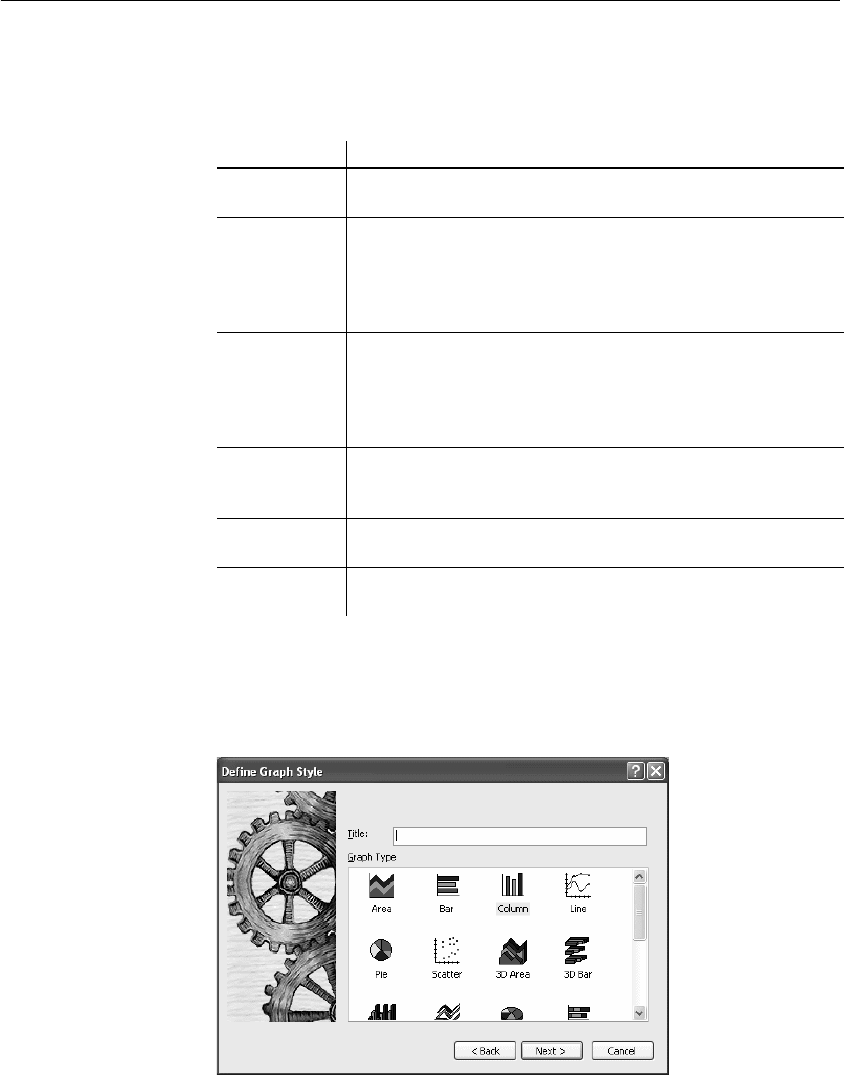
Types of graphs
DataWindow Designer provides many types of graphs for you to choose from.
You choose the type on the Define Graph Style page in the DataWindow wizard
or in the General page in the Properties view for the graph.
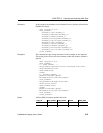
Part of graph What it is
Title An optional title for the graph. The title appears at the top of the
graph.
Value axis The axis of the graph along which the values of the dependent
variable(s) are plotted. In a column graph, as shown in the
preceding graph, the Value axis corresponds to the y axis in an XY
presentation. In other types of graphs, such as a bar graph, the Value
axis can be along the x dimension.
Category axis The axis along which are plotted the major divisions of the data,
representing the independent variable(s). In the preceding graph,
the Category axis corresponds to the x axis. It plots four categories:
Q1, Q2, Q3, and Q4. These form the major divisions of data in the
graph.
Series A set of data points. There are three series in the preceding graph:
Stellar, Cosmic, and Galactic. In bar and column charts, each series
is represented by bars or columns of one color or pattern.
Series axis The axis along which the series are plotted in three-dimensional
(3D) graphs.
Legend An optional listing of the series. The preceding graph contains a
legend that shows how each series is represented in the graph.