


2. ‘lb choose the measurement parameters, press:
3. Substitute a thru for the device under test and perform a frequency response correction.
Refer to “Calibrating the Analyzer,” located at the beginning of this Chapter, for a detailed
procedure.
4.
Reconnect your device under test.
5. To transform the data from the frequency domain to the time domain and set the sweep
from 0 s to 6
ps,
press:
The other time domain modes, low pass step and low pass impulse, are described in
Chapter 6, “Application and Operation Concepts.”
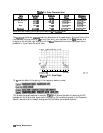
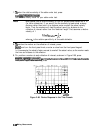
6. To better view the measurement trace, press:
C-j
~~~~;~~~~~~.
ad
turn
the
front
pa&
knob,
or
enter
a
value
from
the
front
i
:.:<<<<<<.:x?!..
. . . . . . .
..:..:..
r.::..>>:.:<?
panel keypad.
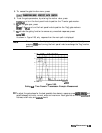
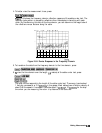
7.
To
measure the peak response from the main path, press:
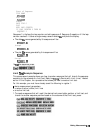
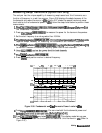
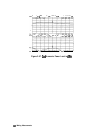
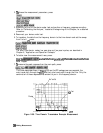
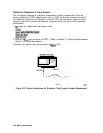
The three responses shown in
Figure
2-59 are the RF leakage near zero seconds, the
main travel path through the
hlter,
and the triple travel path through the filter. Only the
combination of these responses was evident to you in the frequency domain.
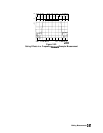
Main Travel Path
Rf Leakage
Triple Travel
Path
Figure 2-59. Time Domain Transmission Example Measurement
2-84 Making Measurements