


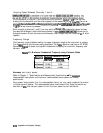
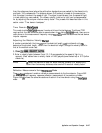
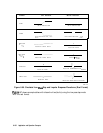
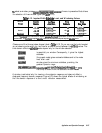

Minimum allowable stop frequencies. The
lowest analyzer measurement frequency is
30
kHz,
therefore for each value of n there is a
minimum
allowable
stop frequency that can
be used. That is, the minimum stop frequency = n x 30
kHz.
‘Ihble
6-l
1 lists the
minimm
frequency range that can be used for each value of n for low pass time domain measurements
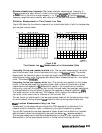
Reflection Measurements In Time Domain Low Pass
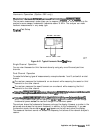
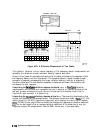
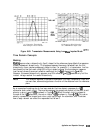
Figure 6-65 shows the time domain response of an unterminated cable in both the low-pass step
and low-pass impulse modes.
Figure 6-65.
Time Domain Low
Pass
Measurements of an Unterminated Cable
Interpreting the low pass response horizontal
axis. The low pass measurement horizontal
axis is the two-way travel time to the discontinuity (as in the
bandpass
mode). The marker
displays both the two-way time and the electrical length along the trace.
‘Ib
determine the
actual physical length, enter the appropriate velocity factor as described earlier in this section
under “Time domain bandpass”
Interpreting the low pass response vertical
axis. The vertical axis depends on the chosen
format. In the low pass mode, the frequency domain data is taken at harmonically related
frequencies and extrapolated to
dc
Because this results in the inverse Fourier transform
having only a real part (the imaginary part is zero), the most useful low pass step mode format
in this application is the real format. It displays the response in reflection coefficient
units.
This mode is similar to the traditional TDR response, which displays the reflected signal in a
real format (volts) versus time (or distance) on the horizontal axis.
The real format can also be used in the low pass impulse mode, but for the best dynamic range
for simultaneously viewing large and
smaIl
discontinuities, use the log magnitude format.
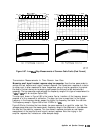
Fault
Location Measurements Using Low Pass
As described, the low pass mode can simulate the TDR response of the test device. This
response contains information useful in
dete
rmining the type of discontinuity present.
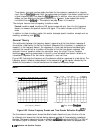
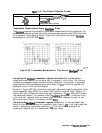
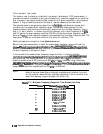
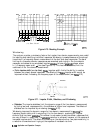
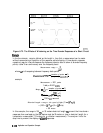
Figure 6-66 illustrates the low pass responses of known discontinuities Each circuit element
was simulated to show the corresponding low pass time domain
Sll
response waveform.
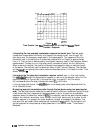
The low pass mode gives the test device response either to a step or to an impulse stimulus.
Mathematically, the low pass impulse stimulus is the derivative of the step stimulus.
AppiicationandOperationConoepts
6-131