


4.
Reconnect your test device.
5.
lb
better view the measurement trace, press:
. . .
,.
,._.,..,.,./.
. . . . .
/
. . . . .
cm)
&q?$f,,
,$&gg#
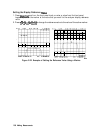
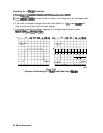
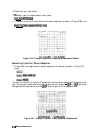
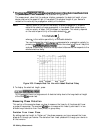
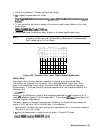
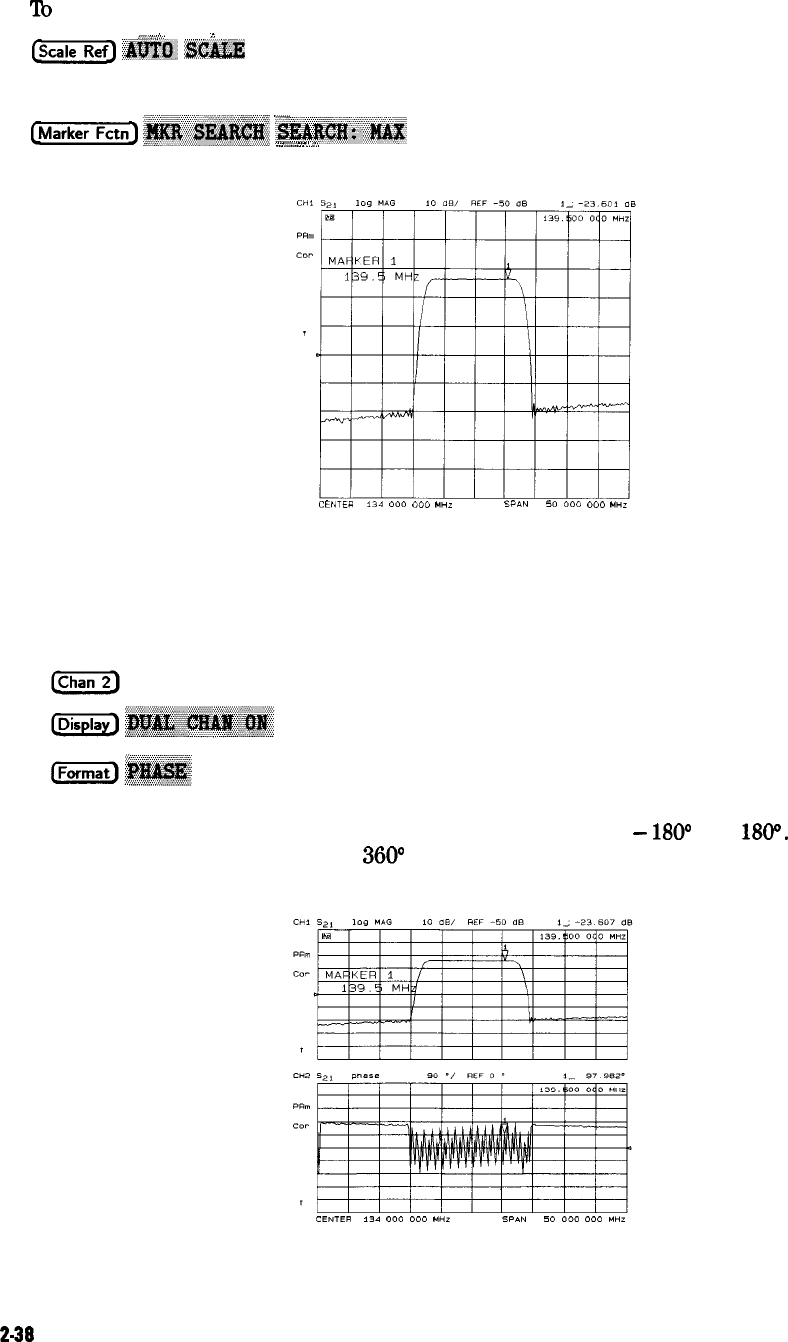
6. To locate the maximum amplitude of the device response, as shown in Figure
2-30,
press:
_
i
_
,..,..
._.
. .
. . . . . .
,......
(jj)
~~~~~~~
~~~~~:~~:.~~~
.
..a
%.;;A...:
.A..
i
./.
CENTER
134
000 000
MHZ
SPAN
50 000 000
MHZ
Figure 2-30. Example Magnitude Response Measurement Results
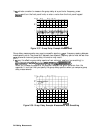
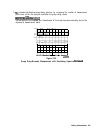
Measuring Insertion Phase Response
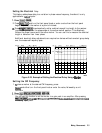
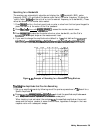
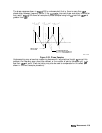
7. To view both the magnitude and phase response of the device, as shown in Figure 2-31,
press:
The channel 2 portion of Figure 2-31 shows the insertion phase response of the device under
test. The analyzer measures and displays phase over the range of
-
MO0
to +
1800.
As phase
changes beyond these values, a sharp
360°
transition occurs in the displayed data.
CENTER 134
000 000
MHZ
SPAN
50 000 000
MHZ
Figure 2-31. Example Insertion Phase Response Measurement
2-36
Making Measurements