


-
0
ERF
Frequency Tracking
L
'11M
11
EDF
,E
SF
11
'1lA
pg653d
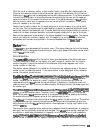
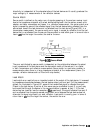
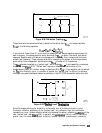
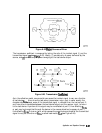
Figure 6-36. Reflection Tracking
Em
These three errors are mathematically related to the actual data,
&A,
and measured data,
&M,
by the following equation:
(SllA&W)
“~4
=
EDF
+
(1
-
EsF$~A)
If the value of these three “E” errors and the measured test device response were known for
each frequency, the above equation could be solved for
S
11A
to obtain the actual test device
response. Because each of these errors changes with frequency, their values must be known
at each test frequency. These values are found by measuring the system at the measurement
plane using three independent standards whose !&A is known at all frequencies
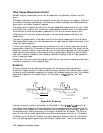
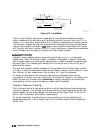
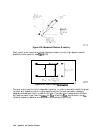
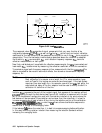
The
first
standard applied is a “perfect load,” which makes
&A
=
0 and essentially measures
directivity (see
Figure
6-37). “Perfect load” implies a reflectionless termination at the
measurement plane. All incident energy is absorbed. With
S
11~
= 0 the equation can be solved
for Enr, the directivity term. In practice, of course, the “perfect load” is difficult to achieve,
although very good broadband loads are available in the HP 87533 compatible calibration kits
l
1’
0
I
i3
50n
S,lA=
0
s
(O)(ERF)
11M
=
EDF+l-E,,o
pg654d
Figure 6-37. “Perfect Load”
‘Ikrmination
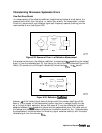
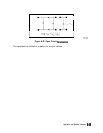
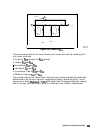
Since the measured value for directivity is the vector sum of the actual directivity plus
the actual reflection coefficient of the “perfect load,”
any reflection from the termination
represents an error. System effective directivity becomes the actual reflection
coel3cient
of the
near “perfect load” (see
Figure
6-38). In general, any
termination
having a return loss value
greater than the uncorrected system directivity reduces reflection measurement uncertainty.
Application and Operation Concepts
6-63