


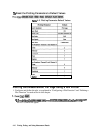

Defining a Plot Function
Note
The plot definition is set to default values whenever the power is cycled.
However, you can save the plot definition by saving the instrument state.
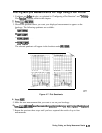
Choosing Display Elements
2.
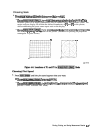
Choose which of the following measurement display elements that you want to appear on
your plot:
q Choose
~~~~,~~~~~~~~
if
you
wmt
the
measurement
data
trace
to
appear
on
your
p1ot.
$
zz<:
,::;;:::z;;
.,,,,
.y
,,s..y
. . . . . . . .
q
Choose
~~~~~~~~~~~
if
you
want
all
of
the
displayed text to appear on your plot. (This
::B,.:‘>>::.:<<<<..
.::
:...&
,,........
..s.....;;..........
. . . . . .
.i
,,..
.::
.
..a
L..
does not include the marker values or softkey labels.)
,,:,:,:,:,
.,...,..
_
.i..:.:..
7:;:...;...........
. . . . . .
q Choose
~~~~~,~~~~~~~~.
if you want the displayed markers, and marker values, to appear on
:<.:...:.s
._.....
.A......
ss.......
.::.i
..A
<:.:A
1:.::
i
your plot.
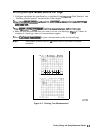
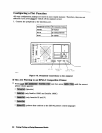
MARKER ON
GRATICULE-
REFERENCE LINE
/
TIME-DATE
TEXT
DATA
CHI
START
1.078
“9
STOP
1.505
“3
Figure 4-4. Plot Components Available through Definition
pg6150d
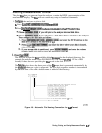
Selecting Auto-Feed
3.
~~~~
~~~~~~
Mtil
the
correct
choice
is
highlighted.
~:.:.:.~~:.~:.~~~~~~~:.:.~,:~~:.:.~:~::~:~.::.:.:~~.~~~~;~:.~~~~:.;.
<..;:y<:
.~~~.~~~.,l:~~~.:~~~~~
‘a:
0 Choose
~~~~~~~:~~
if
you
want a “page
eject,”
sent to the plotter or
HPGL
compatible
>:<;<o>;:.:
:...,
.;;;:
. . . . . . . . . . . . . . . . . . . . . . . . :..:::.::>::::
i
.:.:
.
.
....
..A
..........~i
.,......
/
_ . . . .
_
printer after each time you press
$$XF&.
4-12
Printing, Plotting, and Saving Measurement Results