


To increase the time domain measurement range,
first
increase the number of points, but
remember that as the number of points increases, the sweep speed decreases. Decreasing the
frequency span also increases range, but reduces resolution.
Resolution
Two different resolution terms are used in the time domain:
n
response resolution
n
range resolution
Response resolution.
Time domain response resolution is defined as the ability to resolve two
closely-spaced responses, or a measure of how close two responses can be to each other and
still be distinguished from each other. For responses of equal amplitude, the response resolution
is equal to the 50% (-6
dD)
impulse width. It is inversely proportional to the measurement
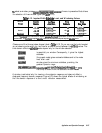
frequency span, and is also a function of the window used in the transform. The approximate
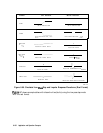
formulas for calculating the 50% impulse width are given in Table 6-12. For example, using the
formula for the
bandpass
mode with a normal windowing function for a 50 MHz to 13.05
GHz
measurement (13.0
GHz
span):
50% calculated impulse width =
0.98
13.0
(GHz)
x
‘2
= 0.151 nanoseconds
Electrical length (in air) =
(0.151 x
lo-’
s) x (30 x
10’
cm/s)
= 4.53 centimeters
With this measurement, two equal responses can be distinguished when they are separated
by at least 4.53 centimeters. In a measurement with a 20
GHz
span, two equal responses can
be distinguished when.they are separated by at least 2.94 cm. Using the low pass mode (the
low pass frequencies are slightly different) with a minimum windowing function, you can
distinguish two equal responses that are about 1.38 centimeters or more apart.
For reflection measurements, which measure the two-way time to the response, divide the
response resolution by 2. Using the example above, you can distinguish two faults of equal
magnitude provided they are 0.69 centimeters (electrical length) or more apart.
Note
Remember, to determine the physical length, the relative velocity factor of
the transmission medium under test must be entered into the electrical length
equation.
For example, a cable with a teflon dielectric (0.7 relative velocity factor), measured under the
conditions stated above, has a fault location measurement response resolution of
0.45 centimeters. This is the maximum fault location response resolution. Factors such as
reduced frequency span, greater frequency domain data windowing, and a large discontinuity
shadowing the response of a smaller discontinuity, all act to degrade the effective response
resolution.
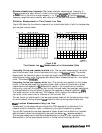
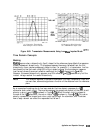
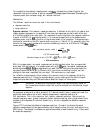
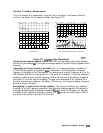
Figure 6-73 illustrates the effects of response resolution. The solid line shows the actual
reflection measurement of two approximately equal discontinuities (the input and output of an
SMA barrel). The dashed line shows the approximate effect of each discontinuity, if they could
be measured separately.
Application and Operation Concepts
6-139