


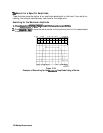
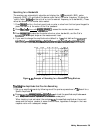
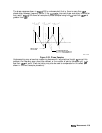
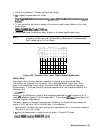
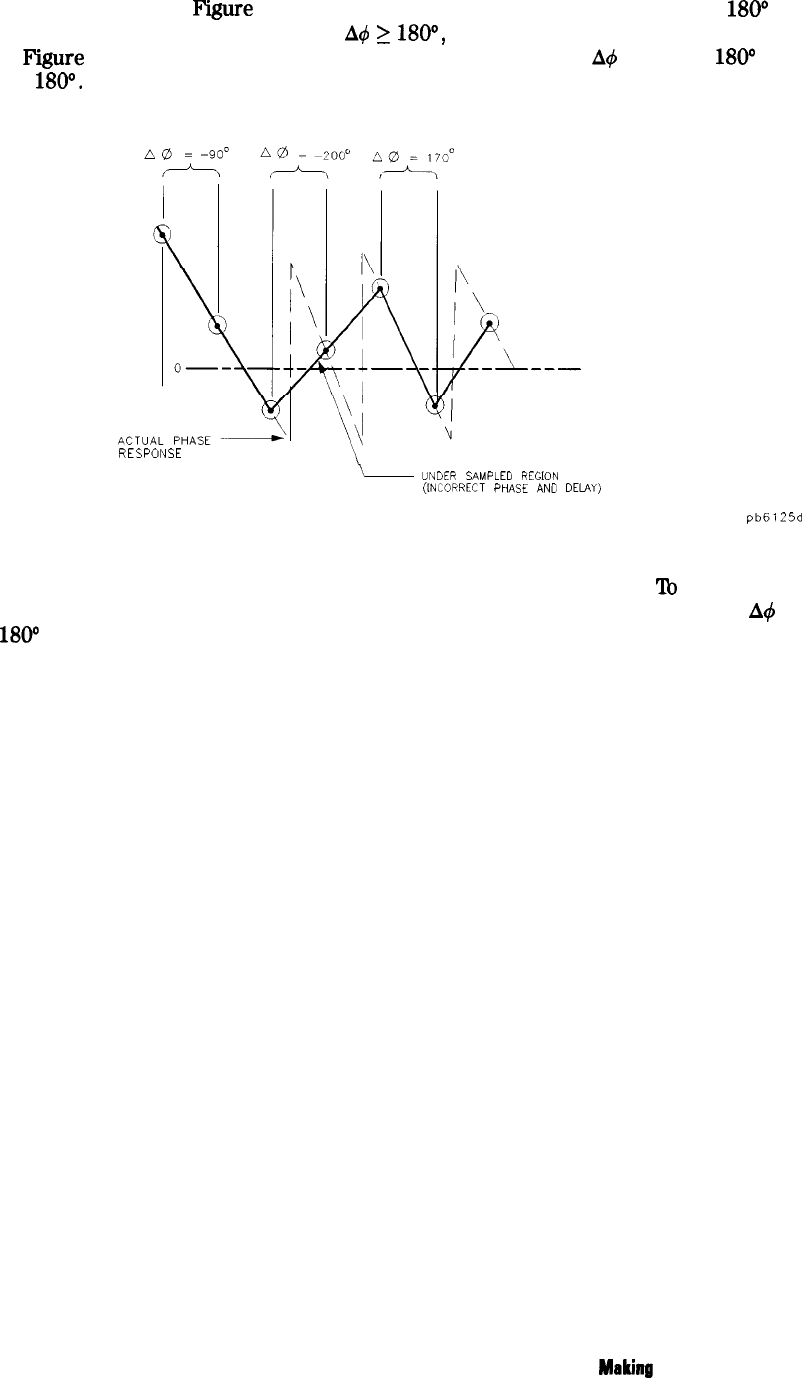
The phase response shown in
F’igure
2-32 is undersampled; that is, there is more than
HO0
phase delay between frequency points If the
A4
2
HO”,
incorrect phase and delay information
may result.
Figure
2-32 shows an example of phase samples being with
A+
less than
MO0
and
greater than
MOO.
RESPONSE
\
UNDER
SAMPLED
REGION
(INCORRECT
PHASE
AND
DELAY)
pb6125d
Figure 2-32. Phase Samples
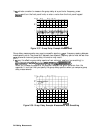
Undersampling may arise when measuring devices with long electrical length.
‘Ib
correct this
problem, the frequency span should be reduced, or the number of points increased until
A4
is
less than
180”
per point. Electrical delay may also be used to compensate for this effect (as
shown in the next example procedure).
Makinfl
Measurements 2-39