


Time domain low pass impulse mode simulates the time domain response of an impulse
input (like the
bandpass
mode). Both low pass modes yield better time domain resolution for
a given frequency span than does the
bandpass
mode. In addition, when using the low pass
modes, you can determine the type of discontinuity. However, these modes have certain
limitations that are
defined
in “Time domain low pass,
n
later in this section.
The analyzer has one time-to-frequency transform mode:
Forward
transform
mode
transforms CW signals measured over time into the frequency
domain, to measure the spectral content of a signal. This mode is known as the CW time
mode.
In addition to these transform modes, this section discusses special transform concepts such as
masking, windowing, and
gating.
General Theory
The relationship between the frequency domain response and the time domain response of
the analyzer is defined by the Fourier transform. Because of this transform, it is possible to
measure, in the frequency domain, the response of a linear test device and mathematically
calculate the inverse Fourier transform of the data to find the time domain response. The
analyzer’s internal computer makes this calculation using the chirp-Z Fourier transform
technique. ‘Ihe resulting measurement is the fully error-corrected time domain reflection or
transmission response of the test device, displayed in near real-time.
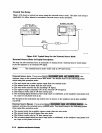
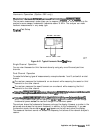
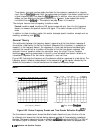
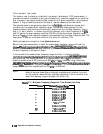
Figure 6-62 illustrates the frequency and time domain reflection responses of a test device. The
frequency domain reflection measurement is the composite of
ail
the signals reflected by the
discontinuities present in the test device over the measured frequency range.
Note
In this section, all points of reflection are referred to as discontinuities.
(a) Frequency Domain
(b)
Time Domain
Bandpass
Figure 6-62. Device Frequency Domain and Time Domain Reflection Responses
The time domain measurement shows the effect of each discontinuity as a function of time
(or distance), and shows that the test device response consists of three separate impedance
changes. The second discontinuity has a reflection coefllcient magnitude of 0.035 (i.e. 3.5% of
the incident signal is reflected). Marker 1 on the time domain trace shows the elapsed time
6-126 Application and Operation Concepts