


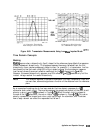
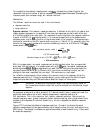
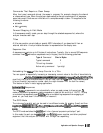

Forward Transform Measurements
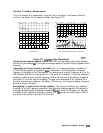
This is an example of a measurement using the Fourier transform in the forward direction,
from the time domain to the frequency domain (see Figure 6-77):
t
i
i
i
i
i
i
i
i
i
1
I
I
,
1
i
i
i
iiiii
t
(a) CW Time
(b) Transform to Frequency Domain
pg6laQ~c
Figure 6-77.
Ampltier
Gain Measurement
Interpreting the forward transform vertical
axis. With the log magnitude format selected,
the vertical axis displays
dE9.
This format simulates a spectrum analyzer display of power versus
frequency.
Interpreting the forward transform horizontal
axis. In a frequency domain transform of
a CW time measurement, the horizontal
axis
is measured in units of frequency. The center
frequency is the offset of the CW frequency. For example, with a center frequency of 0 Hz, the
CW frequency (250 MHz in the example) is in the center of the display. If the center frequency
entered is a positive value, the CW frequency shifts to the right half of the display; a negative
value shifts it to the left half of the display. The span value entered with the transform on is
the total frequency span shown on the display. (Alternatively, the frequency display values can
be entered as start and stop.)
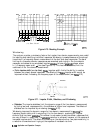
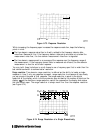
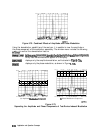
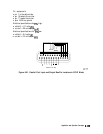
Demodulating
the
results of the forward transform.
The forward transform can separate
the effects of the CW frequency modulation amplitude and phase components. For example, if
a test device modulates the transmission response
(&I)
with a 500 Hz AM signal, you can see
the effects of that modulation as shown in Figure 6-78.
To
simulate this effect, apply a 500 Hz
sine wave to the analyzer rear panel EXT AM input.
Application and Operation Conwpts
6-143