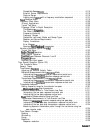
4-2. Printing Two Measurements
........................
4-3. Peripheral Connections to the Analyzer
...................
4-4. Plot Components Available through Definition
................
4-5. Line Types Available
..................
.cY
/
1.
...............
4-6. Locations of Pl and
P2
in
~Z&U&.:.F~~~.
[GRAT]-
Mode
............
..
.
........
..u
.......
.........:...:.......................
.
.......
:%.:%.A..
...............
.
.....
.
...................
4-7. Plot Quadrants
..............................
4-8. Automatic
File
Naming Convention for LIF Format
..............
4-9. Plot Filename Convention
.........................
4-10. Plotting Two
Files
on the Same Page
....................
4-11. Plot Quadrants
..............................
4-12. Data Processing Flow Diagram
.......................
5-l.
Standard Connections for a Response Error-Correction for Reflection
Measurement.
.............................
5-2. Standard Connections for Response Error-Correction for Transmission
Measurements
.............................
5-3. Standard Connections for Receiver Calibration
................
5-4. Standard Connections for a Response and Isolation Error-Correction for
Reflection Measurements
........................
5-5. Standard Connections for a Response and Isolation Error-Correction for
Transmission Measurements
.......................
5-6. Standard Connections for a One Port Reflection Error-Correction
.......
5-7. Standard Connections for
FuIi
Two port Error-Correction
..........
5-8. Sample-and-Sweep Mode for Power Meter Calibration
............
5-9. Continuous Correction Mode for Power Meter Calibration
..........
5-10. Noninsertable Device
...........................
5-11. Adapters Needed
.............................
5-12. Two-Port
Cal
Set 1
.............................
5-13.Two-PortCaISet2
.............................
5-14. Calibrated Measurement
..........................
5-15. Calibrating for Noninsertable Devices
....................
6-l.
SimpIified
Block Diagram of the Network Analyzer System
..........
6-2.
Data Processing Flow Diagram
.......................
6-3.
Active Channel Keys
............................
6-4. Entry Block
................................
6-5.
Stimulus
Function Block
..........................
6-6. Power Range Transitions in the Automatic Mode
...............
6-7. Response Function Block
..........................
6-8.
S-Parameters of a Two-Port Device
.....................
6-9. Reflection Impedance and Admittance Conversions
.............
6-10. Transmission Impedance and Admittance Conversions
............
6-11. Log Magnitude Format
...........................
6-12. Phase Format
...............................
6-13. Group Delay Format
............................
6-14. Standard and Inverse Smith Chart Formats
.................
6-15. Polar Format
...............................
6-16. Linear Magnitude Format.
.........................
6-17.
Typical
SWR Display
............................
6-18.
Real
Format
................................
6-19. Constant Group Delay
...........................
6-20.
I-I.&her
Order Phase Shift
..........................
6-21. Rate of Phase Change Versus Frequency
..................
6-22. Variations in Frequency Aperture
......................
6-23.
Dual
Channel Displays
...........................
6-24. 4
Param
Displays Menu
...........................
6-25.
Effect of Averaging on a Trace
.......................
4-7
4-8
4-12
4-14
4-15
4-17
4-19
4-26
4-27
4-28
4-37
5-10
5-11
5-12
5-15
5-17
5-19
5-21
5-37
5-38
5-40
5-41
5-42
5-43
5-44
5-46
6-2
6-4
6-8
6-10
6-12
6-15
6-28
6-29
6-31
6-31
6-33
6-33
6-34
6-35
6-35
6-36
6-36
6-37
6-38
6-38
6-39
6-39
6-43
6-47
6-51
Contents-19


