


To
Calculate the Statistics of the Measurement Data
This function calculates the mean, standard deviation, and peak-to-peak values of the section
of the displayed trace between the active marker and the delta reference. If there is no delta
reference, the analyzer calculates the statistics for the entire trace.
1.
press
(Marker_)
~~:~~~~~~
&&j@$:,$-
to
m&e
maker
1
a
reference
m&es.
:..:..:.:
.
.
.
.
.
s<
:..c..
;...~.:~.:.:..1.:..:.~.:.~...
,......
::.
;..;;;......
.:...:
.
.
.
.
.
.
.
.
.
:.:.
2. Move marker 1 to any point that you want to reference:
n
Turn the front panel knob.
OR
n
Enter the frequency value on the numeric keypad,
3.
press
~~~~:
and
move
marker
2
to
any
position
*at
you
wat
to
measure
h
reference
to marker 1.
:.::.
,.:.:.
.;,.:.y
4.
Press
[)Fctn)
~~~~~~~~~~
~~~~~~~~
to
cd&ate
md
view
the
mem,
smdard
deviation, and peak-to-peak values of the section of the measurement data between the
active marker and the delta reference marker.
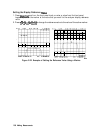
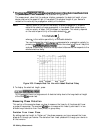
An application for this feature is to
fmd
the peak-to-peak value of
passband
ripple without
searching separately for the maximum and minimum values.
If you are viewing a measurement in the polar or Smith Chart format, the analyzer
calculates the statistics using the
first
value of the complex pair (magnitude, real part,
resistance, or conductance).
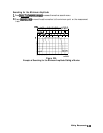
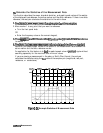
CHl S21
I
og
MRG
20
dB/
REF 0
dB
2: -3.7131 dB
b 26. 04 0 0
MHz
PRm
MARKLR
2-e
26.304
ItHz
aREF-1
neon-
-8.
931 5 dB
B
deu:
1 5481
dB
P-P
5.6718 dB
I
I
I
I
I
I
I
I
I I
I
CENTER 125 000 000 MHz
SPAN
120.000 000 MHz
Figure
Z-28.
Example Statistics of Measurement Data
2-36
Makin Measurements