


‘I&ble
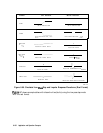
6-10. Time Domain Reflection Formats
Format
Parameter
LlN
MAG
Reflection Coefficient
(unitless)
(0
<
p< 1)
REAL Reflection
Cbdicient
(unitless) (- 1
<
p< 1)
LOGMAG
Retnm
Loss
(dB)
SWR
Standing Wave Ratio (unitless)
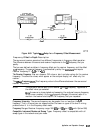
Transmission Measurements Using
Bandpass
Mode
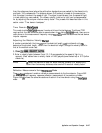
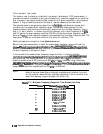
The
bandpass
mode can also transform transmission measurements to the time domain. For
example, this mode can provide information about a surface acoustic wave (SAW) filter that
is not apparent in the frequency domain. Figure 6-64 illustrates a time domain
bandpass
measurement of a 321 MHz SAW
filter.
pg678d
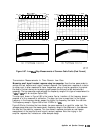
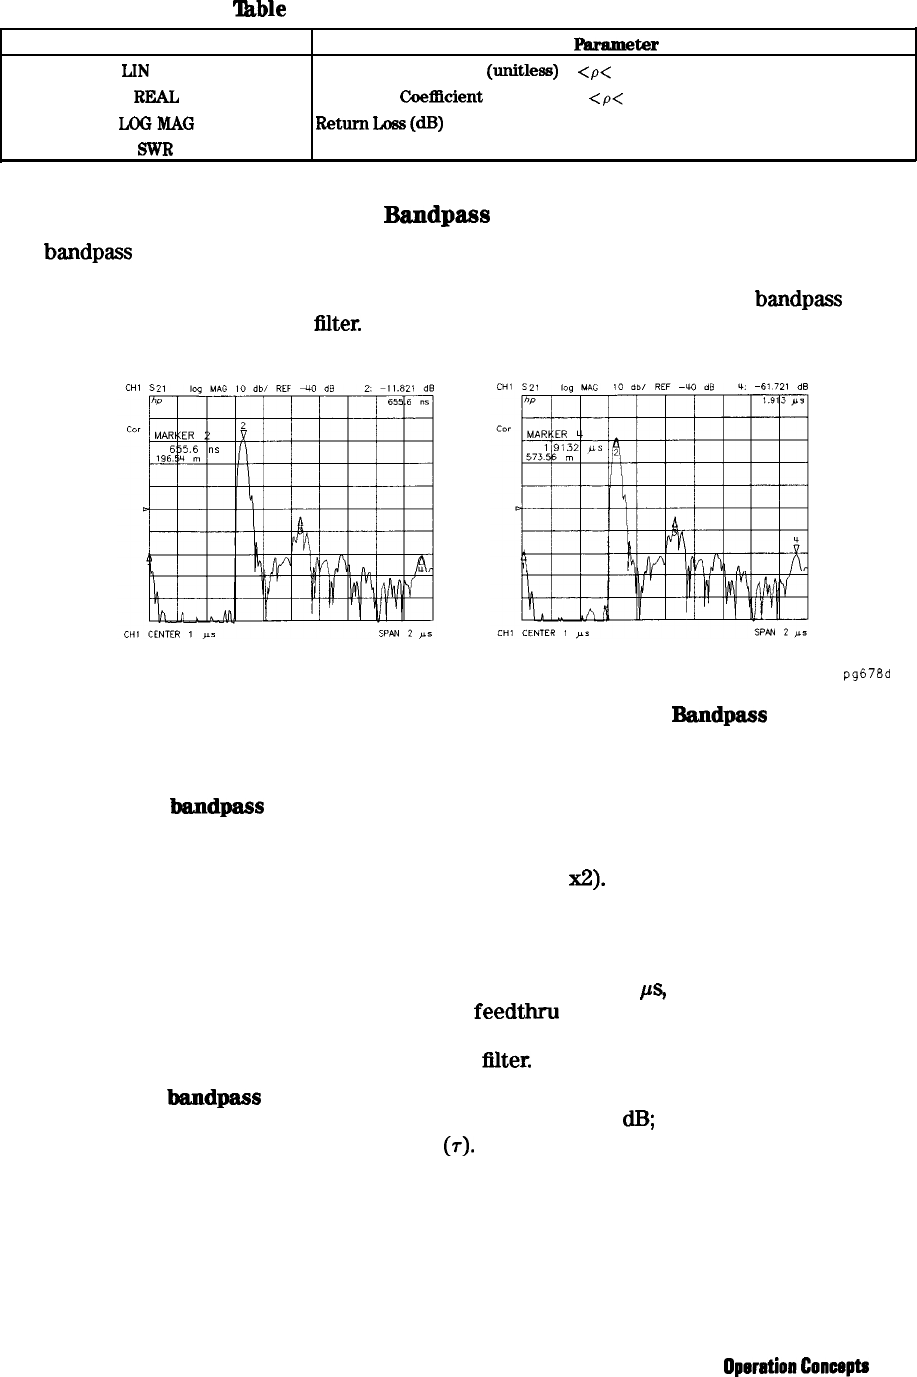
Figure 6-64. Transmission Measurement in Time Domain Bandpass Mode
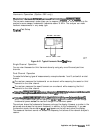
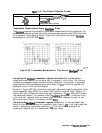
Interpreting the bandpass transmission response horizontal axis. In time
domain
transmission measurements, the horizontal axis is displayed in units of time. The time axis
indicates the propagation delay through the device. Note that in time domain transmission
measurements, the value displayed is the actual delay (not
x2).
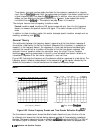
The marker provides the
propagation delay in both time and distance.
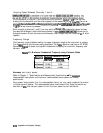
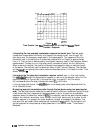
Marker 2 in Figure 6-63 (left) indicates the main path response through the test device, which
has a propagation delay of 655.6 ns, or about 196.5 meters in electrical length. Marker 4 in
Figure 6-63 (right) indicates the triple-travel path response at 1.91
ps,
or about 573.5 meters.
The response at marker 1 (at 0 seconds) is an RF feedthru leakage path. In addition to the
triple travel path response, there are several other multi-path responses through the test
device, which are inherent in the design of a SAW
filter.
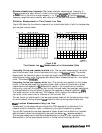
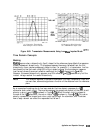
Interpreting the
bandpass
transmission response vertical
axis. In the log magnitude
format, the vertical axis displays the
tr
ansmission loss or gain in
dB;
in the linear magnitude
format it displays the transmission coefficient
(7).
Think of this as an average of the
transmission response over the measurement frequency range.
Application and
OperationConoepts
6-126