


CHI A/R
log
MAG 10
dB/
REF
-70
dB
I
Gd
Hid
CHl
START-7
ns
STOP 7
ns
pgE121d
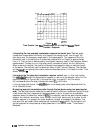
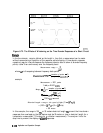
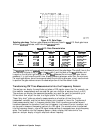
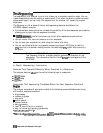
Figure 6-76. Gate Shape
Selecting gate shape.
The four gate shapes available are listed in
lhble
6-13. Each gate has a
different
passband
flatness, cutoff rate, and
sidelobe
levels.
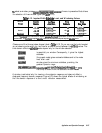
‘able
6-13. Gate Characteristics
Gate
saspe
Gate Span Minimum
Nod
Wide
Maximum
Passband
Ripple
fO.10
dJ3
l
0.01
dB
fO.O1
dF3
fO.O1
dB
Sidelobe
Levels
-48dB
-68
dE3
-57
dB
-70
dB
cntoff
1.4IFreq
Span
Z.S/Freq
Span
4.4fFreq
Span
12.7IFreq
Span
Minimnm
Gate span
Z.S/Freq
Span
6.6/l%eq
Span
S.S/Freq
Span
25.4lFYeq
Span
The
passband
ripple and
sidelobe
levels are descriptive of the gate shape. The cutoff time is the
time between the stop time (-6
dB
on the
Alter
skirt) and the peak of the
f&t
sidelobe, and
is equal on the left and right side skirts of the
Inter.
Because the minimum gate span has no
passband, it is just twice the cutoff time. Always choose a gate span wider than the minimum.
For most applications, do not be concerned about the minimum gate span, simply use the knob
to position the gate markers around the desired portion of the time domain trace.
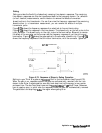
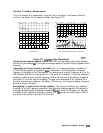
Transforming CW Time Measurements Into the Frequency Domain
The analyzer can display the amplitude and phase of CW signals versus time. For example, use
this mode for measurements such as amplifier gain as a function of warmup time (i.e. drift).
The analyzer can display the measured parameter (e.g. amplifier gain) for periods of up to
24 hours and then output the data to a digital plotter for hardcopy results.
These “strip chart” plots are actually measurements as a function of time (time is the
independent variable), and the horizontal display axis is scaled in time units. Transforms of
these measurements result in frequency domain data. Such transforms are called forward
transforms because the transform from time to frequency is a forward Fourier transform, and
can be used to measure the spectral content of a CW signal. For example, when transformed
into the frequency domain, a pure CW signal measured over time appears as a single frequency
spike. The transform into the frequency domain yields a display that looks similar to a
spectrum analyzer display of signal amplitude versus frequency.
6-142
Application and Operation Concepts