


Hardware Description
3-104 Copyright © 2003-2007 ARM Limited. All rights reserved. ARM DUI 0224F
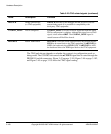
3.22.2 ChipScope integrated logic analyzer
The ChipScope connector (J33) enables you to connect a ChipScope compatible
analyzer to the configuraion scan chain while a JTAG debugger is connected to the
debug scan chain. This enables you to debug the FPGAs on stacked tiles while
examining code on the CPU.
Note
In debug mode:
• the ChipScope connector is enabled
• the FPGA on the baseboard is excluded from the configuration scan chain.
In configuration mode:
• the ChipScope connector is disabled
• the FPGA on the baseboard is included in the configuration scan chain.
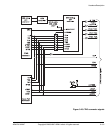
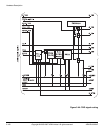
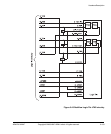
See JTAG signal routing on page 3-102 and RealView Logic Tile JTAG circuitry on
page 3-103 for full routing details.
For more details on the integrated logic analyzer, see the ChipScope details on the
Xilinx website (www.xilinx.com).
3.22.3 Embedded trace support
The ARM926EJ-S PXP Development Chip incorporates an ARM9 Embedded Trace
Macrocell (ETM9). This enables you to carry out real-time debugging by connecting
external trace equipment to the Trace connector on the PB926EJ-S. To trace program
flow, the ETM broadcasts branch addresses, data accesses, and status information
through the trace port. Later in the debug process, the complete instruction flow can be
reconstructed by the ARM Trace Debug Tools (TDT) or RealView Debugger. The
ETM9 in the ARM926EJ-S PXP Development Chip is a medium size ETM9 Rev 2a.
Note
Connection of the trace port analyzer is described in Connecting the Trace Port
Analyzer on page 2-10.