


Getting Started
2-12 Copyright © 2003-2007 ARM Limited. All rights reserved. ARM DUI 0224F
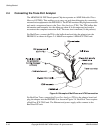
2.4.1 About using trace
The components used for trace capture are:
ETM The Embedded Trace Macrocell is part of the ARM926EJ-S PXP
Development Chip. It monitors the ARM core buses and outputs
compressed information through the trace port to a trace connector. The
on-chip ETM contains trigger and filter logic to control what is traced.
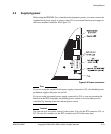
Trace connector and adaptor board
The trace connector enables you to connect a TPA to the PB926EJ-S. The
connector is a high-density AMP Mictor connector. The pinout for this
connector is provided in Test and debug connections on page A-33.
The adaptor board buffers the high-speed signals between the Trace
connector and the Trace Port Analyzer.
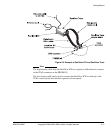
JTAG unit This is a protocol converter that converts debug commands from the
debugger into JTAG messages for the ETM.
Trace Port Analyzer
The TPA is an external device (such as RealView Trace) that connects to
the trace connector (through the adaptor board) and stores information
sent from the ETM.
Debugger and Trace software
The debugger and trace software controls the JTAG, ETM, and Trace Port
Analyzer. The trace software reconstructs program flow from the
information captured in the Trace Port Analyzer.
Note
The trace and debug components must match the debugger you are using:
ARM eXtended Debugger (AXD)
AXD is a component of the ARM Developer Suite (ADS). Use AXD with
Multi-ICE, Trace Debug Toolkit, and Multi-Trace.
ARM RealView Debugger (RVD)
RVD is a component of RealView Compilation Tools (RVCT). Use RVD
with RealView ICE and RealView Trace or with Multi-ICE and
Multi-Trace.