C-Series Debugging and Diagnostics | 1181
Recognizing a High CPU Condition
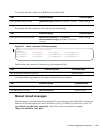
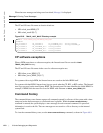
A high CPU condition exist when any of the messages in Message 10 appear.
Troubleshoot a high CPU condition
If FTOS indicates a high CPU condition or you suspect one:
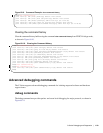
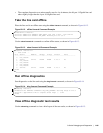
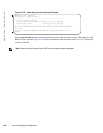
show hardware cpu data-plane
View driver-level statistics for the data-plane port on the CPU for the
specified line card or RPM.
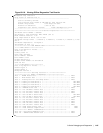
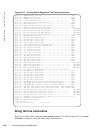
show hardware unit
Views advanced counters, statistics, and register information for the FP
and CSF ASICs.
Message 10 High CPU Condition
Feb 13 13:56:16: %RPM1-S:CP %CHMGR-5-TASK_CPU_THRESHOLD: Cpu usage above threshold for task
"sysAdmTsk"(100.00%) in CP.
Feb 13 13:56:20: %RPM1-S:CP %CHMGR-5-CPU_THRESHOLD: Overall cp cpu usage above threshold. Cpu5SecUsage
(100)
Feb 13 13:56:20: %RPM1-S:CP %CHMGR-5-TASK_CPU_THRESHOLD_CLR: Cpu usage drops below threshold for task
"sysAdmTsk"(0.00%) in CP.
Step Task Command Syntax Command Mode
1 Enable debug cpu-traffic-stats, and monitor the output
with the show cpu-traffic-stats command. These
commands indicate the physical interface through which
the questionable traffic is arriving.
debug cpu-traffic-stats
show cpu-traffic-stats
CONFIGURATION
EXEC Privilege
2 Review the show ip traffic command output. This
command displays the types of IP traffic destined to the
CPU.
show ip traffic
EXEC Privilege
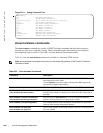
Table 60-3. show hardware Commands
Command Description


