1198 | E-Series TeraScale Debugging and Diagnostics
www.dell.com | support.dell.com
• Write the contents of the trace buffer on page 1216
• Recognize a high CPU condition on page 1217
• Configure an action upon a hardware error on page 1217
• Core dumps on page 1218
Overview
The FTOS diagnostics and debugging features are a proactive approach to maximizing system uptime and
reducing meantime to resolution (MTTR) when a problem occurs. This feature set includes a combination
of proactive and reactive components designed to alert the user to network events, automatically collect
information on the event, and allow the user to collect diagnostic information from the system.
• Proactive component
• The system health check detects, reports, and takes action on an error in real time.
• When an automatic corrective action is not appropriate, the system health check reports the
detected anomaly, in real time, via a syslog message and/or SNMP.
• Reactive component
• When an error condition is asserted, appropriate show and debug commands are available to assist
in identifying the condition as well as rapid fault isolation.
System health checks
An automatic runtime loopback test monitors the overall health status of the dataplane. This loopback test
runs while the system’s switch fabric is up; detecting potential blockages in the system’s usual data transfer
path.
Runtime dataplane loopback check
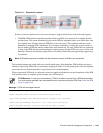
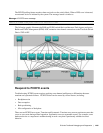
This is a dataplane loopback health check. Periodically, the primary RPM and each line card, in an online
start, sends a packet through the dataplane channels, verifying the packet is returned, and then verifying the
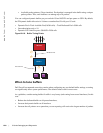
dataplane is functioning as expected (see Figure 61-1). Both portpipes on the line cards are tested.
Note: These diagnostics and debugability features are available on TeraScale systems only, unless
specifically noted.


