


Monitoring, Reporting, Notifications, and the Event Log
Monitoring Sessions
Chapter 7310
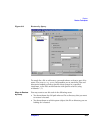
The progress and status of current sessions appear in the Results
Area. You can sort the sessions by clicking the column headings in
the Results Area.
TIP To view the details of a running session, double click the session. The
detailed monitor view of the session appears.
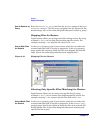
Viewing Finished Sessions
As soon as a session is finished or is aborted, it is no longer displayed in
the Data Protector GUI, Monitor context. The finished session is moved
to the Internal Database context.
Use the following steps to view finished sessions:
1. In the Data Protector GUI, switch to the Internal Database context.
If you are running the Manager-of-Managers, select Monitor in the
Context List, and then select a Cell Manager of your choice. From the
Tools menu, select Database Administration to open a new Data
Protector GUI with the Internal Database context selected.
2. Expand Sessions to display all the sessions stored in the IDB.
The sessions are sorted by date.
To view details on a specific session, double-click the session.
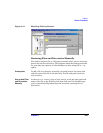
Responding to Mount Requests
Data Protector issues a mount request in the following cases:
• The end of the currently used medium has been reached and Data
Protector needs a free medium.
• A mail slot is open. In this case, shut the mail slot.
You respond to a mount request to confirm that the needed medium is in
a device. Use the following procedure to respond to the mount request
while monitoring the session:
1. In the Context List, select Monitor.