Intel
®
IXP42X Product Line of Network Processors and IXC1100 Control Plane Processor
September 2006 DM
Order Number: 252480-006US 139
Intel XScale
®
Processor—Intel
®
IXP42X product line and IXC1100 control plane processors
3.7.4 Performance Monitoring Events
Table 60 lists events that may be monitored. Each of the Performance Monitor Count
Registers (PMN0, PMN1, PMN2, and PMN3) can count any listed event. Software selects
which event is counted by each PMNx register by programming the evtCountx fields of
EVTSEL.
Some typical combinations of counted events are listed in this section and summarized
in Table 61. In this section, we call such an event combination a mode.
Note: PMN0 and PMN1 were used for illustration purposes only. Given there are four event
counters, more elaborate combination of events could be constructed. For example,
one performance run could select 0xA, 0xB, 0xC, 0x9 events from which data cache
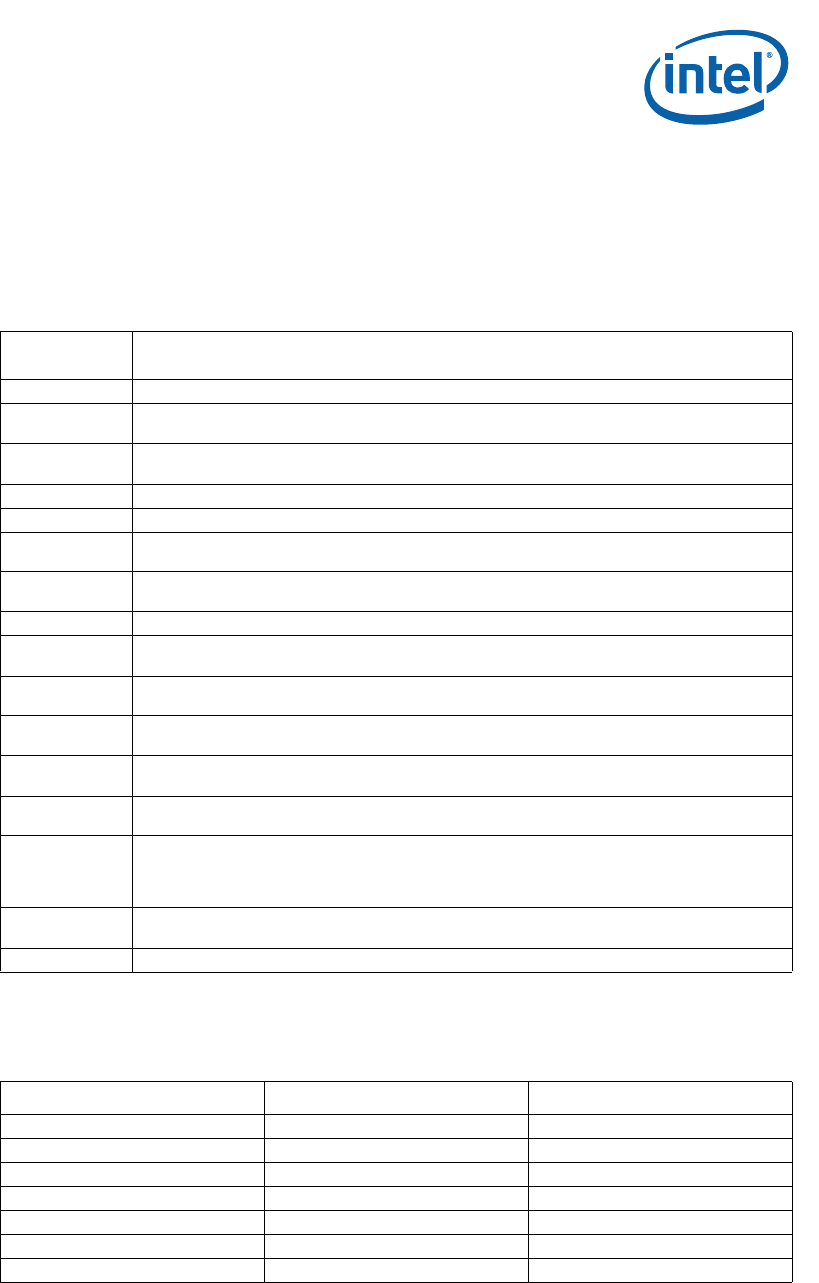
Table 60. Performance Monitoring Events
Event Number
(evtCountx)
Event Definition
0x0 Instruction cache miss requires fetch from external memory.
0x1
Instruction cache cannot deliver an instruction. This could indicate an ICache miss or an
ITLB miss. This event will occur every cycle in which the condition is present.
0x2
Stall due to a data dependency. This event will occur every cycle in which the condition is
present.
0x3 Instruction TLB miss.
0x4 Data TLB miss.
0x5
Branch instruction executed, branch may or may not have changed program flow. (Counts
only B and BL instructions, in both ARM and Thumb mode.)
0x6
Branch incorrectly predicted. (Counts only B and BL instructions, in both ARM and Thumb
mode.)
0x7 Instruction executed.
0x8
Stall because the data cache buffers are full. This event will occur every cycle in which the
condition is present.
0x9
Stall because the data cache buffers are full. This event will occur once for each contiguous
sequence of this type of stall.
0xA
Data cache access, not including Cache Operations (defined in “Register 7: Cache
Functions” on page 81)
0xB
Data cache miss, not including Cache Operations (defined in “Register 7: Cache Functions”
on page 81)
0xC
Data cache write-back. This event occurs once for each 1/2 line (four words) that are
written back from the cache.
0xD
Software changed the PC. All ‘b’, ‘bl’, ‘blx’, ‘mov[s] pc, Rm’, ‘ldm Rn, {Rx, pc}’, ‘ldr pc,
[Rm]’, pop {pc} will be counted. An ‘mcr p<cp>, 0,pc, ...’, will not. The count also does not
increment when an event occurs and the PC changes to the event address, e.g., IRQ, FIQ,
SWI, etc.
0x10 through
0x17
Reserved.
all others Reserved, unpredictable results
Table 61. Common Uses of the PMU
Mode EVTSEL.evtCount0 EVTSEL.evtCount1
Instruction Cache Efficiency 0x7 (instruction count) 0x0 (ICache miss)
Data Cache Efficiency 0xA (Dcache access) 0xB (DCache miss)
Instruction Fetch Latency 0x1 (ICache cannot deliver) 0x0 (ICache miss)
Data/Bus Request Buffer Full 0x8 (DBuffer stall duration) 0x9 (DBuffer stall)
Stall/Writeback Statistics 0x2 (data stall) 0xC (DCache writeback)
Instruction TLB Efficiency 0x7 (instruction count) 0x3 (ITLB miss)
Data TLB Efficiency 0xA (Dcache access) 0x4 (DTLB miss)


