Developer’s Manual March, 2003 12-7
Intel
®
80200 Processor based on Intel
®
XScale
™
Microarchitecture
Performance Monitoring
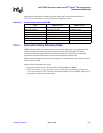
Some typical combination of counted events are listed in this section and summarized in
Table 12-5. In this section, we call such an event combination a mode.
12.5.1 Instruction Cache Efficiency Mode
PMN0 totals the number of instructions that were executed, which does not include instructions
fetched from the instruction cache that were never executed. This can happen if a branch
instruction changes the program flow; the instruction cache may retrieve the next sequential
instructions after the branch, before it receives the target address of the branch.
PMN1 counts the number of instruction fetch requests to external memory. Each of these requests
loads 32 bytes at a time.
Statistics derived from these two events:
• Instruction cache miss-rate. This is derived by dividing PMN1 by PMN0.
• The average number of cycles it took to execute an instruction or commonly referred to as
cycles-per-instruction (CPI). CPI can be derived by dividing CCNT by PMN0, where CCNT
was used to measure total execution time.
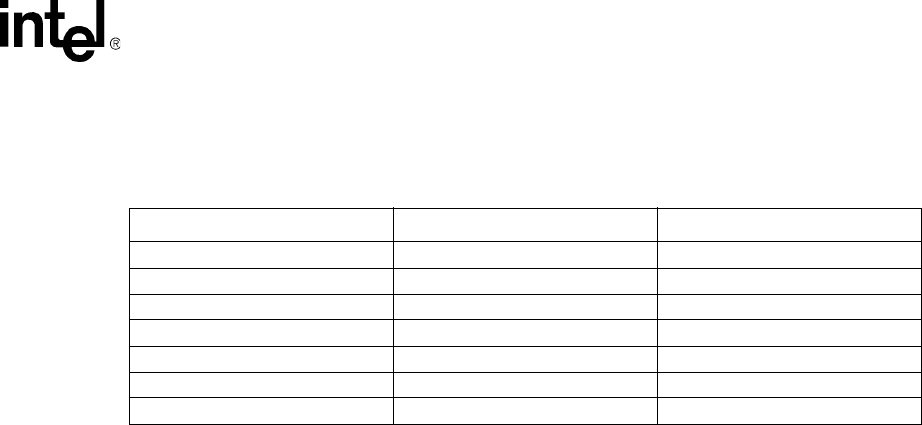
Table 12-5. Some Common Uses of the PMU
Mode PMNC.evtCount0 PMNC.evtCount1
Instruction Cache Efficiency 0x7 (instruction count) 0x0 (ICache miss)
Data Cache Efficiency 0xA (Dcache access) 0xB (DCache miss)
Instruction Fetch Latency 0x1 (ICache cannot deliver) 0x0 (ICache miss)
Data/Bus Request Buffer Full 0x8 (DBuffer stall duration) 0x9 (DBuffer stall)
Stall/Writeback Statistics 0x2 (data stall) 0xC (DCache writeback)
Instruction TLB Efficiency 0x7 (instruction count) 0x3 (ITLB miss)
Data TLB Efficiency 0xA (Dcache access) 0x4 (DTLB miss)


