


Developer’s Manual March, 2003 13-21
Intel
®
80200 Processor based on Intel
®
XScale
™
Microarchitecture
Software Debug
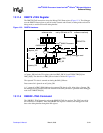
13.11.4 DBGTX JTAG Register
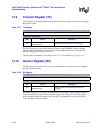
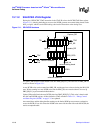
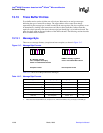
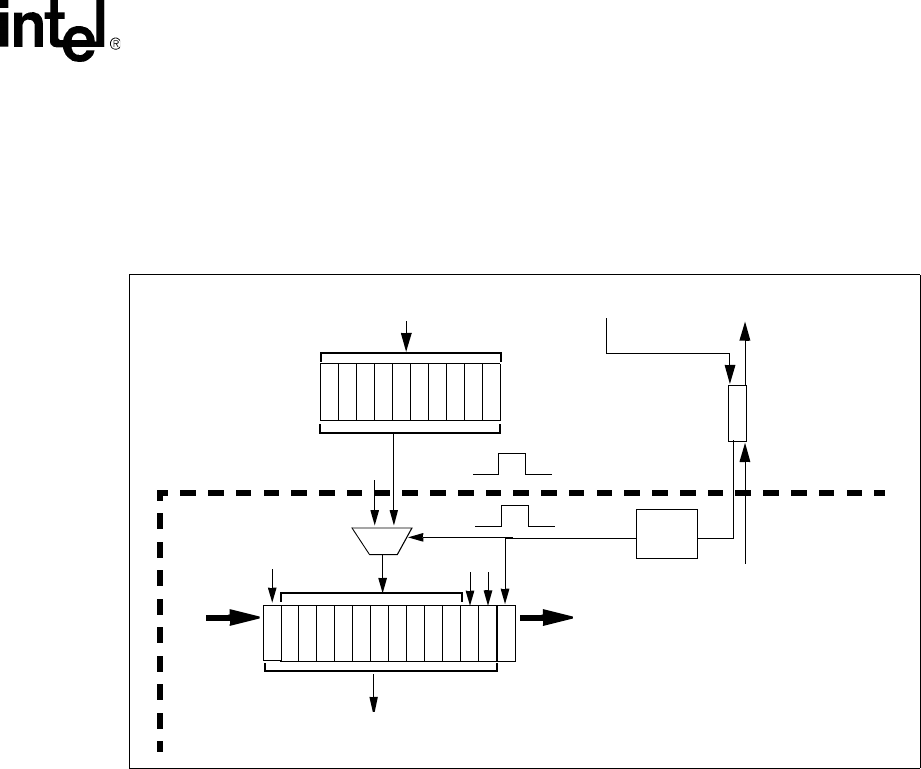
The DBGTX JTAG instruction selects the Debug JTAG Data register (Figure 13-3). The debugger
uses the DBGTX data register to poll for breaks (internal and external) to debug mode and once in
debug mode, to read data from the debug handler.
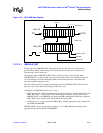
A Capture_DR loads the TX register value into DBG_SR[34:3] and TXRXCTRL[28] into
DBG_SR[0]. The other bits in DBG_SR are loaded as shown in Figure 13-1.
The captured TX value is scanned out during the Shift_DR state.
Data scanned in is ignored on an Update_DR.
A ‘1’ captured in DBG_SR[0] indicates the captured TX data is valid. After doing a Capture_DR,
the debugger must place the JTAG state machine in the Shift_DR state to guarantee that a debugger
read clears TXRXCTRL[28].
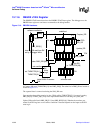
13.11.5 DBGRX JTAG Command
The ‘DBGRX’ JTAG instruction selects the DBGRX JTAG data register. The JTAG opcode for
this instruction is ‘0b00010’. Once the DBGRX data register is selected, the debugger can send
data to the debug handler through the RX register.
Figure 13-3. DBGTX Hardware
TDOTDI
DBG_SR
Capture_DR
Update_DR
123
3435
031
TXRXCTRL
TX
CLK
software read-only
0
0
0
1
28
set by SW write to TX
clear by Debugger read
Ignored
software write
TCLK
delay
0x0000 0000
10
Intel
®
80200 Processor