


41-8
Cisco ASDM User Guide
OL-16647-01
Chapter 41 Monitoring Interfaces
PPPoE Client
Graph/Table
The Graph window shows a graph for the selected statistics. The Graph window can show up to four
graphs and tables at a time. By default, the graph or table displays the real-time statistics. If you enable
History Metrics, page 6-6, you can view statistics for past time periods.
Fields
• View—Sets the time period for the graph or table. To view any time period other than real-time,
enable History Metrics, page 6-6. The data is updated according to the specification of the following
options:
–
Real-time, data every 10 sec
–
Last 10 minutes, data every 10 sec
–
Last 60 minutes, data every 1 min
–
Last 12 hours, data every 12 min
–
Last 5 days, data every 2 hours
• Export—Exports the graph in comma-separated value format. If there is more than one graph or
table on the Graph window, the Export Graph Data dialog box appears. Choose one or more of the
graphs and tables listed by checking the box next to the name.
• Print—Prints the graph or table. If there is more than one graph or table on the Graph window, the
Print Graph dialog box appears. Choose the graph or table you want to print from the Graph/Table
Name list.
• Bookmark—Opens a browser window with a single link for all graphs and tables on the Graphs
window, as well as individual links for each graph or table. You can then copy these URLs as
bookmarks in your browser. ASDM does not have to be running when you open the URL for a graph;
the browser launches ASDM and then displays the graph.
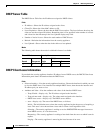
Modes
The following table shows the modes in which this feature is available:
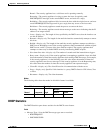
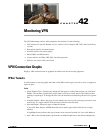
PPPoE Client
The PPPoE Client Lease Information pane displays information about current PPPoE connections.
Firewall Mode Security Context
Routed Transparent Single
Multiple
Context System
• • • •—
Firewall Mode Security Context
Routed Transparent Single
Multiple
Context System
• • • •—