


1-25
Cisco ASDM User Guide
OL-16647-01
Chapter 1 Welcome to ASDM
System Home Pane
System Home Pane
The ASDM system home pane lets you view important status information about your adaptive security
appliance. Many of the details available on the ASDM system home pane are available elsewhere in
ASDM, but this pane shows at-a-glance how your adaptive security appliance is running. Status
information on the system home pane is updated every ten seconds.
Note This pane is available only in the security context.
Fields
• Device List—Displays the list of devices to which you can connect. For more information, see
Device List, page 1-13.
• Interface Status—Shows the following information:
–
Interface—Display only. Shows the type of interface to which you are connected. Choose an
interface to view the total amount of traffic through the interface.
–
Contexts—Display only. Shows the current contexts of users (for example, admin).
–
Line—Display only. Shows the line status, which can be Up or Down.
–
Link—Display only. Shows the link status, which can be Up or Down.
–
Kbps—Display only. Shows the current connection speed in kilobits per second.
• CPU Status—Shows the following CPU and context usage statistics:
–
Total Usage tab—Display only. Shows the total percentage of CPU usage and the total
percentage of CPU usage history in seconds.
–
Context Usage tab—Display only. Shows the total percentage of context usage in three formats:
a table, or a pie or bar chart. The tabular view provides a filtering feature to show only the top
five or top ten users of a specific resource. In addition, this view can show peak usage.
• Connection Status—Shows the following connection usage and context connection usage statistics:
–
Total Connections tab—Display only. Shows the total number of connections.
–
Context Connections tab—Display only. Shows the total number of context connections in three
formats: a table, or a pie or bar chart. The tabular view provides a filtering feature to show only
the top five or top ten users of a specific resource. In addition, this view can show peak usage.
• Memory Status—Shows the following CPU and context usage statistics:
–
Total Usage tab—Display only. Shows the total amount of memory usage in MB and the total
amount of memory usage history in MB.
–
Context Usage tab—Display only. Shows the total amount of memory usage in various contexts
in MB in three formats: a table, or a pie or bar chart. The tabular view provides a filtering feature
to show only the top five or top ten users of a specific resource. In addition, this view can show
peak usage.
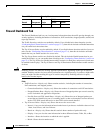
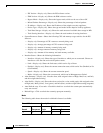
Modes
The following table shows the modes in which this feature is available: